In my earlier
Using M its much easier to perform these calculations since you can easily access the current Row or Record using Power Query/M unlike DAX where you have to manually create a list of current row items.
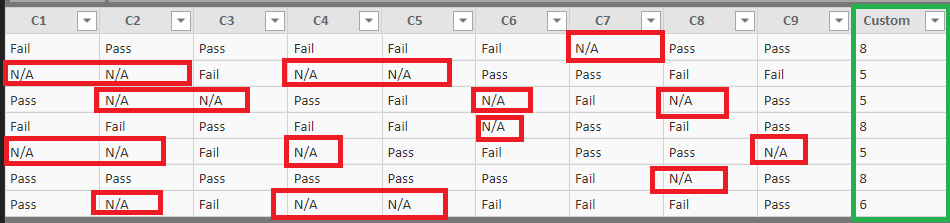
In the pic below, we have 9 Columns (C1 to C9) and we want to count the number of columns that contain either “Pass” or “Fail” for each row. The final desired column is the custom column in green below
The approach to solving this question goes like this
>> Convert each row/record to a list using Record.ToList function
>>Use List.Select to select only “Pass” and “Fail” from the list
>>List.Count to count above list
You can do
List.Count(
List.Select(
Record.ToList(_),
each _ ="Pass" or _ ="Fail")
            )