Suppose we have monthly sales for 10 Products as follows.
Our objectives are to
- Compute the Maximum Monthly Sales for each of these products.
- Determine the Month with Maximum Sales for each product
| Product | Jan | Feb | Mar | Apr | May | Jun | Jul | Aug | Sep | Oct | Nov | Dec |
| A | 423 | 488 | 489 | 111 | 355 | 426 | 226 | 266 | 395 | 480 | 326 | 112 |
| B | 107 | 208 | 230 | 397 | 213 | 499 | 110 | 364 | 376 | 480 | 110 | 443 |
| C | 301 | 498 | 430 | 191 | 256 | 421 | 178 | 173 | 408 | 367 | 162 | 222 |
| D | 457 | 115 | 270 | 372 | 482 | 487 | 482 | 146 | 475 | 493 | 235 | 488 |
| E | 353 | 224 | 338 | 171 | 216 | 412 | 273 | 255 | 326 | 179 | 245 | 500 |
| F | 452 | 253 | 238 | 208 | 482 | 405 | 305 | 210 | 360 | 396 | 182 | 407 |
| G | 240 | 351 | 397 | 496 | 280 | 282 | 215 | 469 | 147 | 472 | 492 | 126 |
| H | 113 | 116 | 300 | 353 | 202 | 371 | 224 | 421 | 434 | 400 | 360 | 145 |
| I | 152 | 474 | 150 | 272 | 256 | 410 | 150 | 364 | 314 | 391 | 338 | 220 |
| J | 329 | 135 | 379 | 481 | 203 | 391 | 167 | 419 | 322 | 446 | 409 | 209 |
LIMITATIONS
Ideally.. this datatable should be unpivoted first…….But here we assume that unpivoting is not desirable..User does not want to change the data structure.
SOLUTIONS
Using Power Query
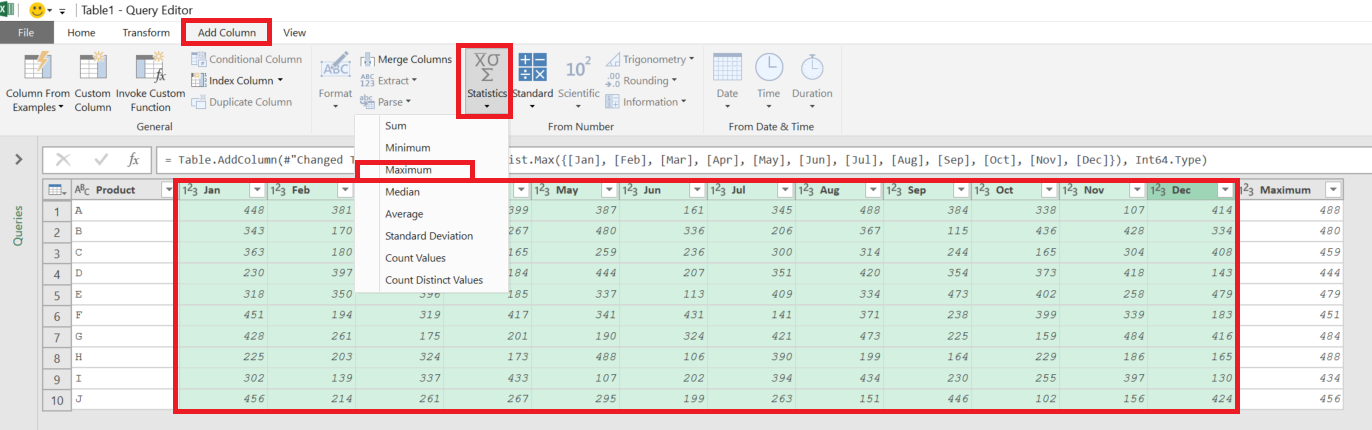
QUERY Editor / POWER QUERY provides a very quick and convenient way to Aggregate Multiple Columns.
Just select all the COLUMNS>>>Go to “Add Column” Tab>>>”Statistics”>>>Choose the Aggregation “Maximum”
Using DAX Calculated Column
In this case our VALUES are spread across multiple Columns and in a Single Row. …To make matters worst…MAX function in DAX allows only 2 arguments…
One option could be to nest MAX functions inside other MAX functions
Max Value = Max(Max(Max(Max(Max(Max(Max(Max(Max(Max(Max(TableName[Jan],TableName[Feb]),TableName[Mar]),TableName[Apr]),TableName[May]),TableName[Jun]),TableName[Jul]),TableName[Aug]),TableName[Sep]),TableName[Oct]),TableName[Nov]),TableName[Dec])
A better approach however would be to create a temp table which transposes each ROW of Multiple Columns into a SINGLE Column with Multiple Rows
![]()
i.e.
Maximum_Value =
VAR temp = {
 TableName[Jan],
 TableName[Feb],
 TableName[Mar],
 TableName[Apr],
 TableName[May],
 TableName[Jun],
 TableName[Jul],
 TableName[Aug],
 TableName[Sep],
 TableName[Oct],
 TableName[Nov],
 TableName[Dec] }
RETURN
 MAXX ( temp, [Value] )
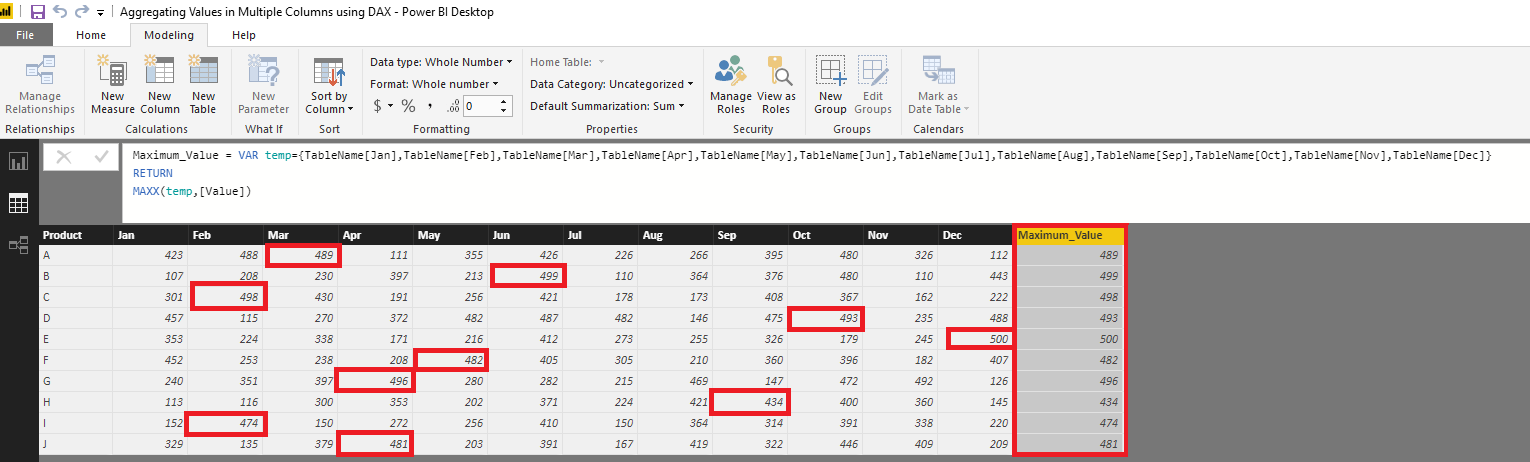
However, the above approach will provide us with Maximum Value…But how to get the column (Month Name) with Maximum Value
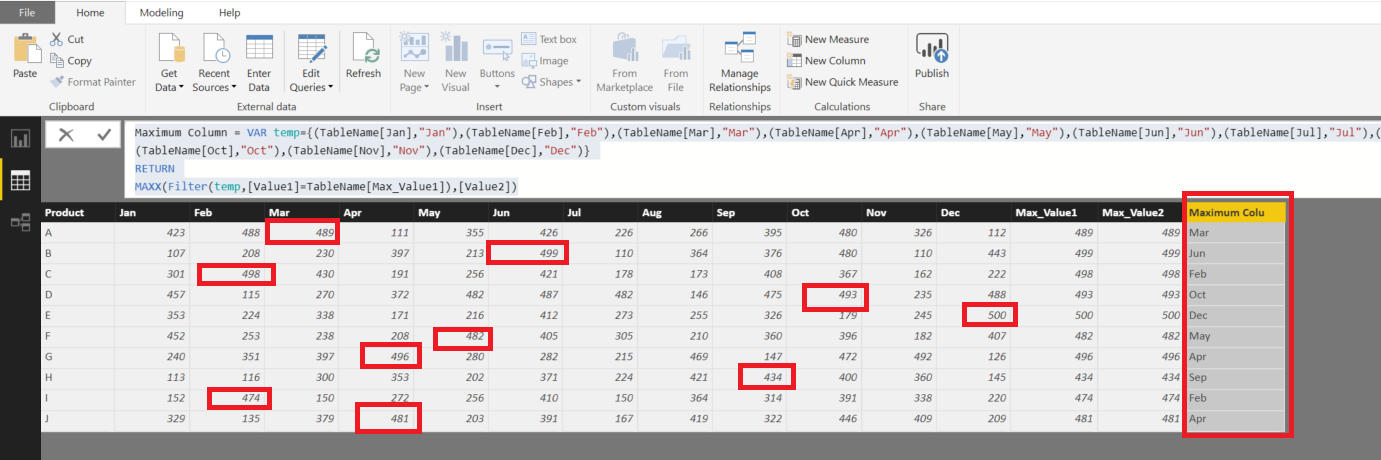
So even better approach would be to transpose 2 rows of data …the Column Headers plus the Values i.e.
![]()
i.e.
Maximum Column =
VAR temp = {
 ( TableName[Jan], "Jan" ),
 ( TableName[Feb], "Feb" ),
 ( TableName[Mar], "Mar" ),
 ( TableName[Apr], "Apr" ),
 ( TableName[May], "May" ),
 ( TableName[Jun], "Jun" ),
 ( TableName[Jul], "Jul" ),
 ( TableName[Aug], "Aug" ),
 ( TableName[Sep], "Sep" ),
 ( TableName[Oct], "Oct" ),
 ( TableName[Nov], "Nov" ),
 ( TableName[Dec], "Dec" ) }
RETURN
 MAXX ( FILTER ( temp, [Value1] = TableName[Max_Value1] ), [Value2] )
Click here to download the pbix File and play with it