“ROW” function returns a table with a single row containing values that result from the expressions given to each column.
ROW(<name>, <expression>[[,<name>, <expression>]…])
name
You can give any Name but it must be enclosed in double quotes.
expression
Any DAX expression that returns a single scalar value
BASIC EXAMPLE
Suppose we have the following table of Products and Related Sales.
Copy the Table below to Power BI desktop
| Product | Sales |
| A | 8,360 |
| B | 5,794 |
| C | 4,248 |
| D | 4,086 |
| E | 4,382 |
| F | 9,232 |
| G | 5,835 |
| H | 6,664 |
| I | 3,436 |
| J | 4,135 |
| K | 7,260 |
| L | 7,328 |
| M | 9,204 |
| N | 7,205 |
| O | 6,587 |
| P | 7,828 |
| Q | 7,453 |
| R | 6,806 |
| S | 6,361 |
| T | 2,953 |
| U | 1,028 |
| V | 4,988 |
| W | 9,914 |
| X | 6,592 |
| Y | 7,724 |
| Z | 3,200 |
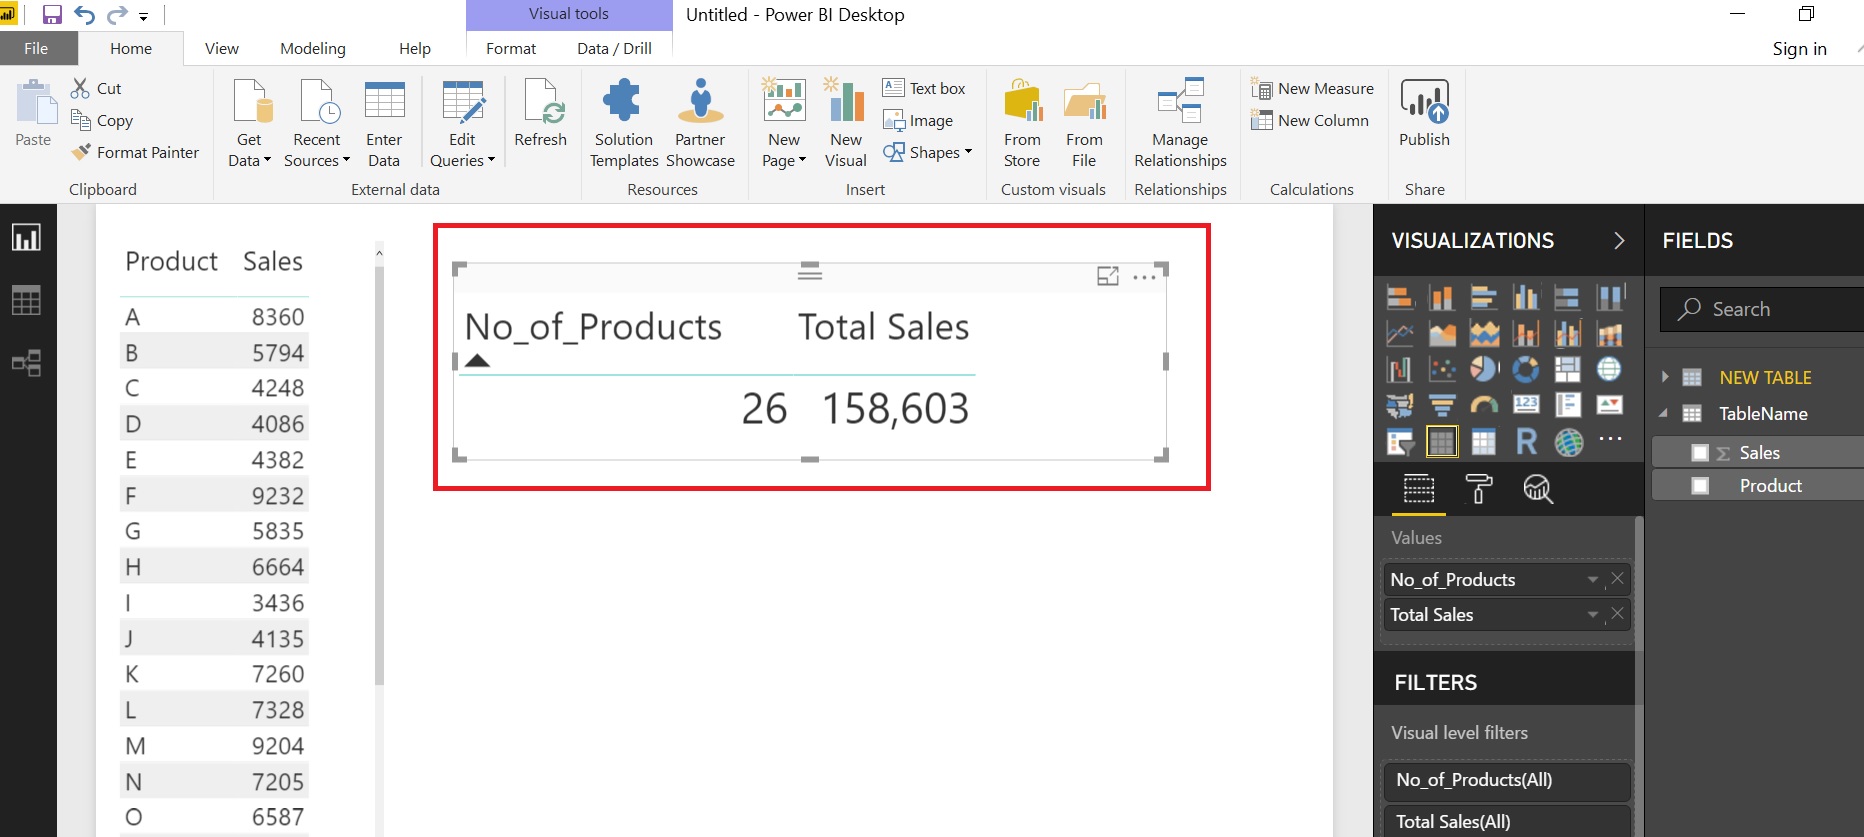
Go to Modelling Tab…. hit the “NEW TABLE” button and enter the formula below
NEW TABLE =
 ROW (
 "No_of_Products", COUNT ( TableName[Product] ),
 "Total Sales", SUM ( TableName[ Sales] )
 )
RESULT:
A single ROW table with 2 columns
ADVANCED EXAMPLE 1
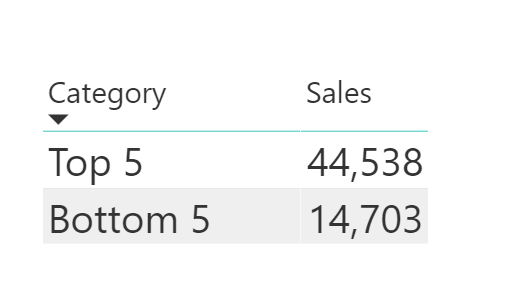
Suppose you want to Compare Sale of Top 5 Products with Next Top 5 (Products Ranked 6 to 10) and Bottom 5 Products.
ROW function along with UNION is very useful in these sort of situations.
Go to Modelling Tab…. hit the “NEW TABLE” button and enter the formula below
Top5 VS Bottom5=
UNION (
 ROW (
 "Category", "Top 5",
 "Sales", CALCULATE (
 SUM ( TableName[ Sales] ),
 TOPN ( 5, TableName, TableName[ Sales], DESC )
 )
 ),
 ROW (
 "Category", "Bottom 5",
 "Sales", CALCULATE (
 SUM ( TableName[ Sales] ),
 TOPN ( 5, TableName, TableName[ Sales], ASC )
 )
 )
)
RESULT