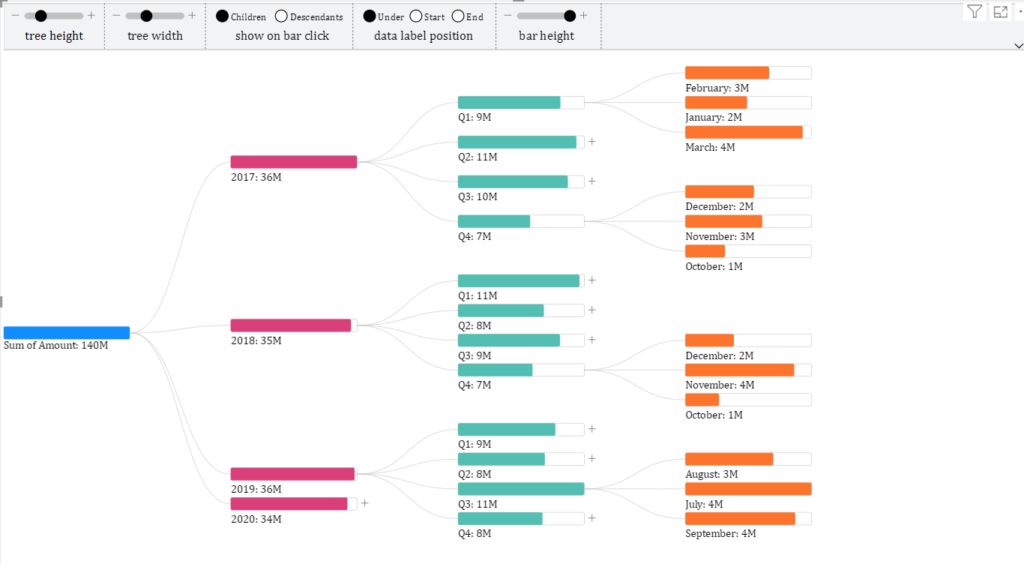
Decomposition Tree – All Expanding is an effort to enhance the native Power BI visual “Decomposition Tree”
A decomposition tree is used to break down a metric or a key performance indicator (KPI) into its contributing factors. It’s commonly used in business analytics to analyze data and identify the underlying causes behind a particular metric’s value.
This custom visual allows users to expand all nodes as compared to Native visual which allows expanding one node at a time

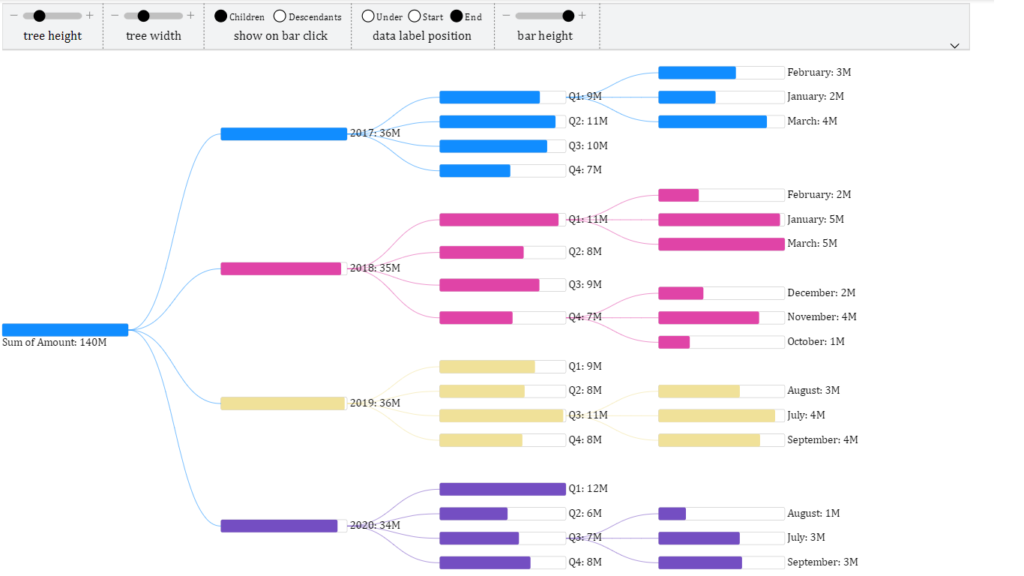
You can choose 2 color patterns. The first one as shown above applies separate colors to each level. The second pattern allows a node and its descendants to have different colors from other nodes. This is depicted in image below

The settings menu at the top of the visual allow you to quickly adjust the chart look and feel
Following short video, provide a quick demo of the features of this custom visual
More details will be added soon
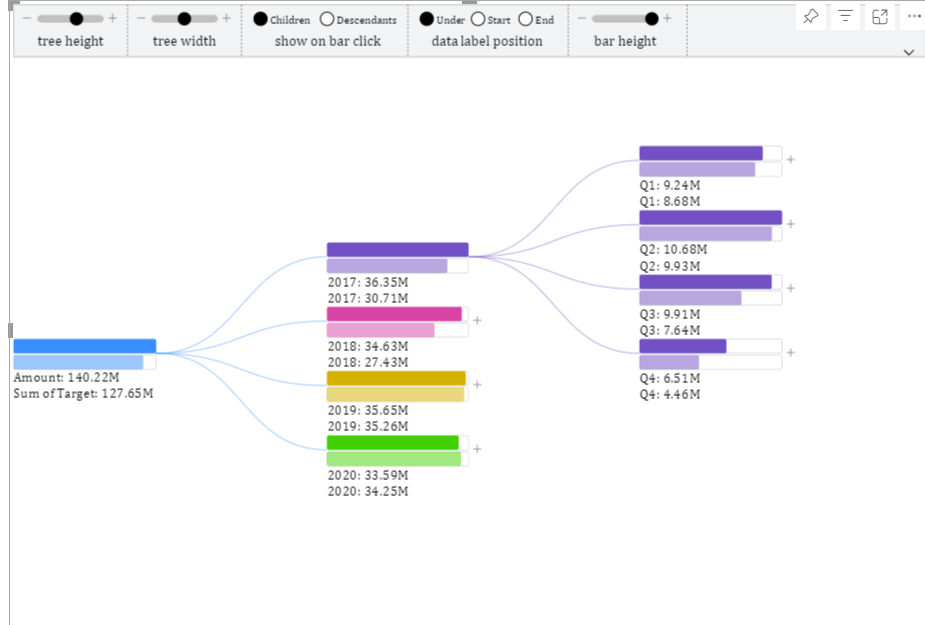
New feature of adding “targets” was added to this chart in version 10 as depicted below. Please see demo chart in APPSOURCE.

Ability to add images was added in version 12

PURCHASE PREMIUM VERSION
To use the visuals without Watermark in Power BI Online, please purchase the Visuals’ license for a 1 year period. License key will be sent to your email ID. You can get the license key in next few hours.
Please contact me at [email protected] or WhatsApp me on +923333225816 to get the price quoteIf you don’t hear back from me, it is most likely due to email authentication problems or SPAM filters. In that case, please leave me a message on Twitter or Linkedin or WhatsApp me on +923333225816