Scroll Bars in Excel Dashboards
In this post I am going to show you how to use Scroll Bars to insert a condensed yet complete table in your Excel Dashboard
But Why Do We Need to Condense Our Tables?
Stephen Few – The Data Visualization Guru, defines a Dashboard as
A visual display of the most important information needed to achieve one or more objectives; consolidated and arranged on a single screen so the information can be monitored at a glance.
Avinash Kaushik writes that
if your dashboard does not fit on one page, you have a report, not a dashboard…This rule is important because it encourages rigorous thought to be applied in selecting the golden dashboard metric.
With so many important pieces of information vying for a place on that Single Screen, Scroll Bars provide a cool way to insert a concise yet comprehensive table in your Dashboard or Report.
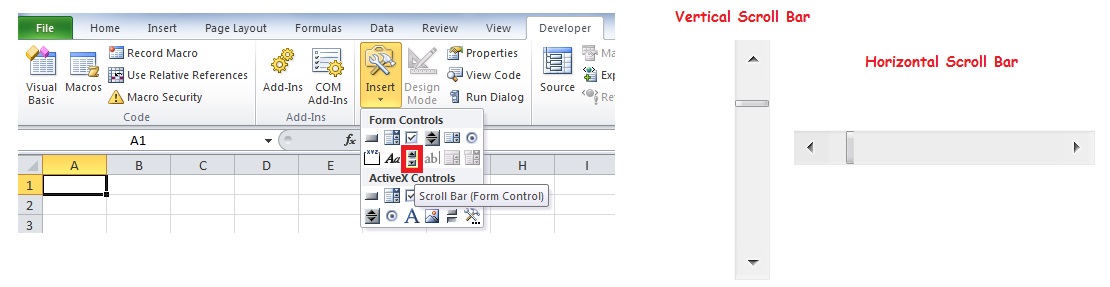
You can insert the Scroll Bars from “Developer” Tab
Click here to Download the sample file
The sample file contains sufficient information to show how Scroll Bar works
The Key Point is that the Maximum Value of the Scroll Bar should be set as the difference of Rows between the No of Rows in the Complete Table and the No of Rows you want to show in the condensed table.