“All that glitters is not GOLD”
Similarly “All Cool Looking Charts are not necessarily Informative Charts”
An Informative Chart is one which conveys information clearly, accurately and instinctively without requiring significant mental effort from the user.
Take a look at charts below. “Which Chart Makes it easy to compare Saudi Telecom’s profitability against Other Entities?
(Saudi Telecom is where I work 🙂 Figures are Dummy)
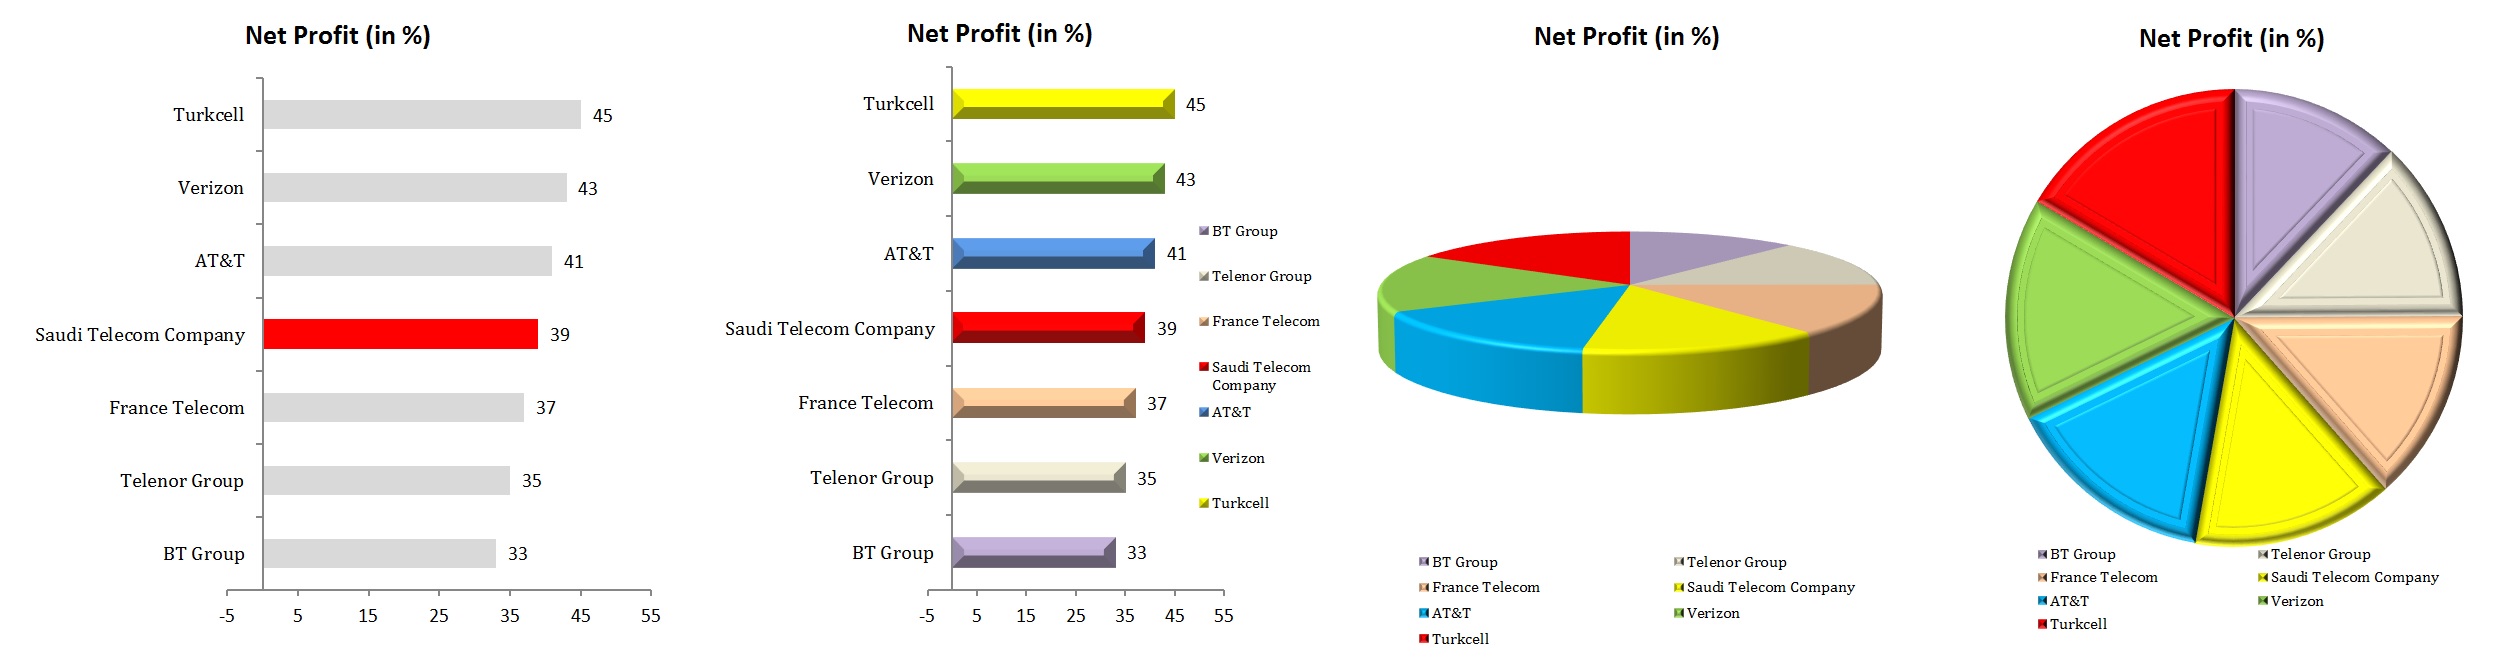
Chart Junk is a term coined by Tufte in his book “The Visual Display of Quantitative Information”.
It refers to elements of the chart that do not convey information. That make you brain busy in wasteful processing.
In this post I will give you some crucial tips to produce Effective Charts and Avoid Chart Junk.
1) USE COLORS SENSIBLY
Maximize Data-Ink Ratio
Effective Charts maximize data-ink ratio which is the proportion of Ink that is used to present actual data compared to the total amount of ink (or pixels) used in the entire display. (Ratio of Data-Ink to non-Data-Ink). Non Data Ink is Chart Junk.
Data Ink Ratio = Data Ink / Total Ink in the Chart
Edward Tufte, known as the pioneer in the field of Data Visualization writes that
“A large share of ink on a graphic should present data-information, the ink changing as the data change. Data-ink is the non-erasable core of a graphic, the non-redundant ink arranged in response to variation in the numbers represented.”
He writes “Above all else show the data”
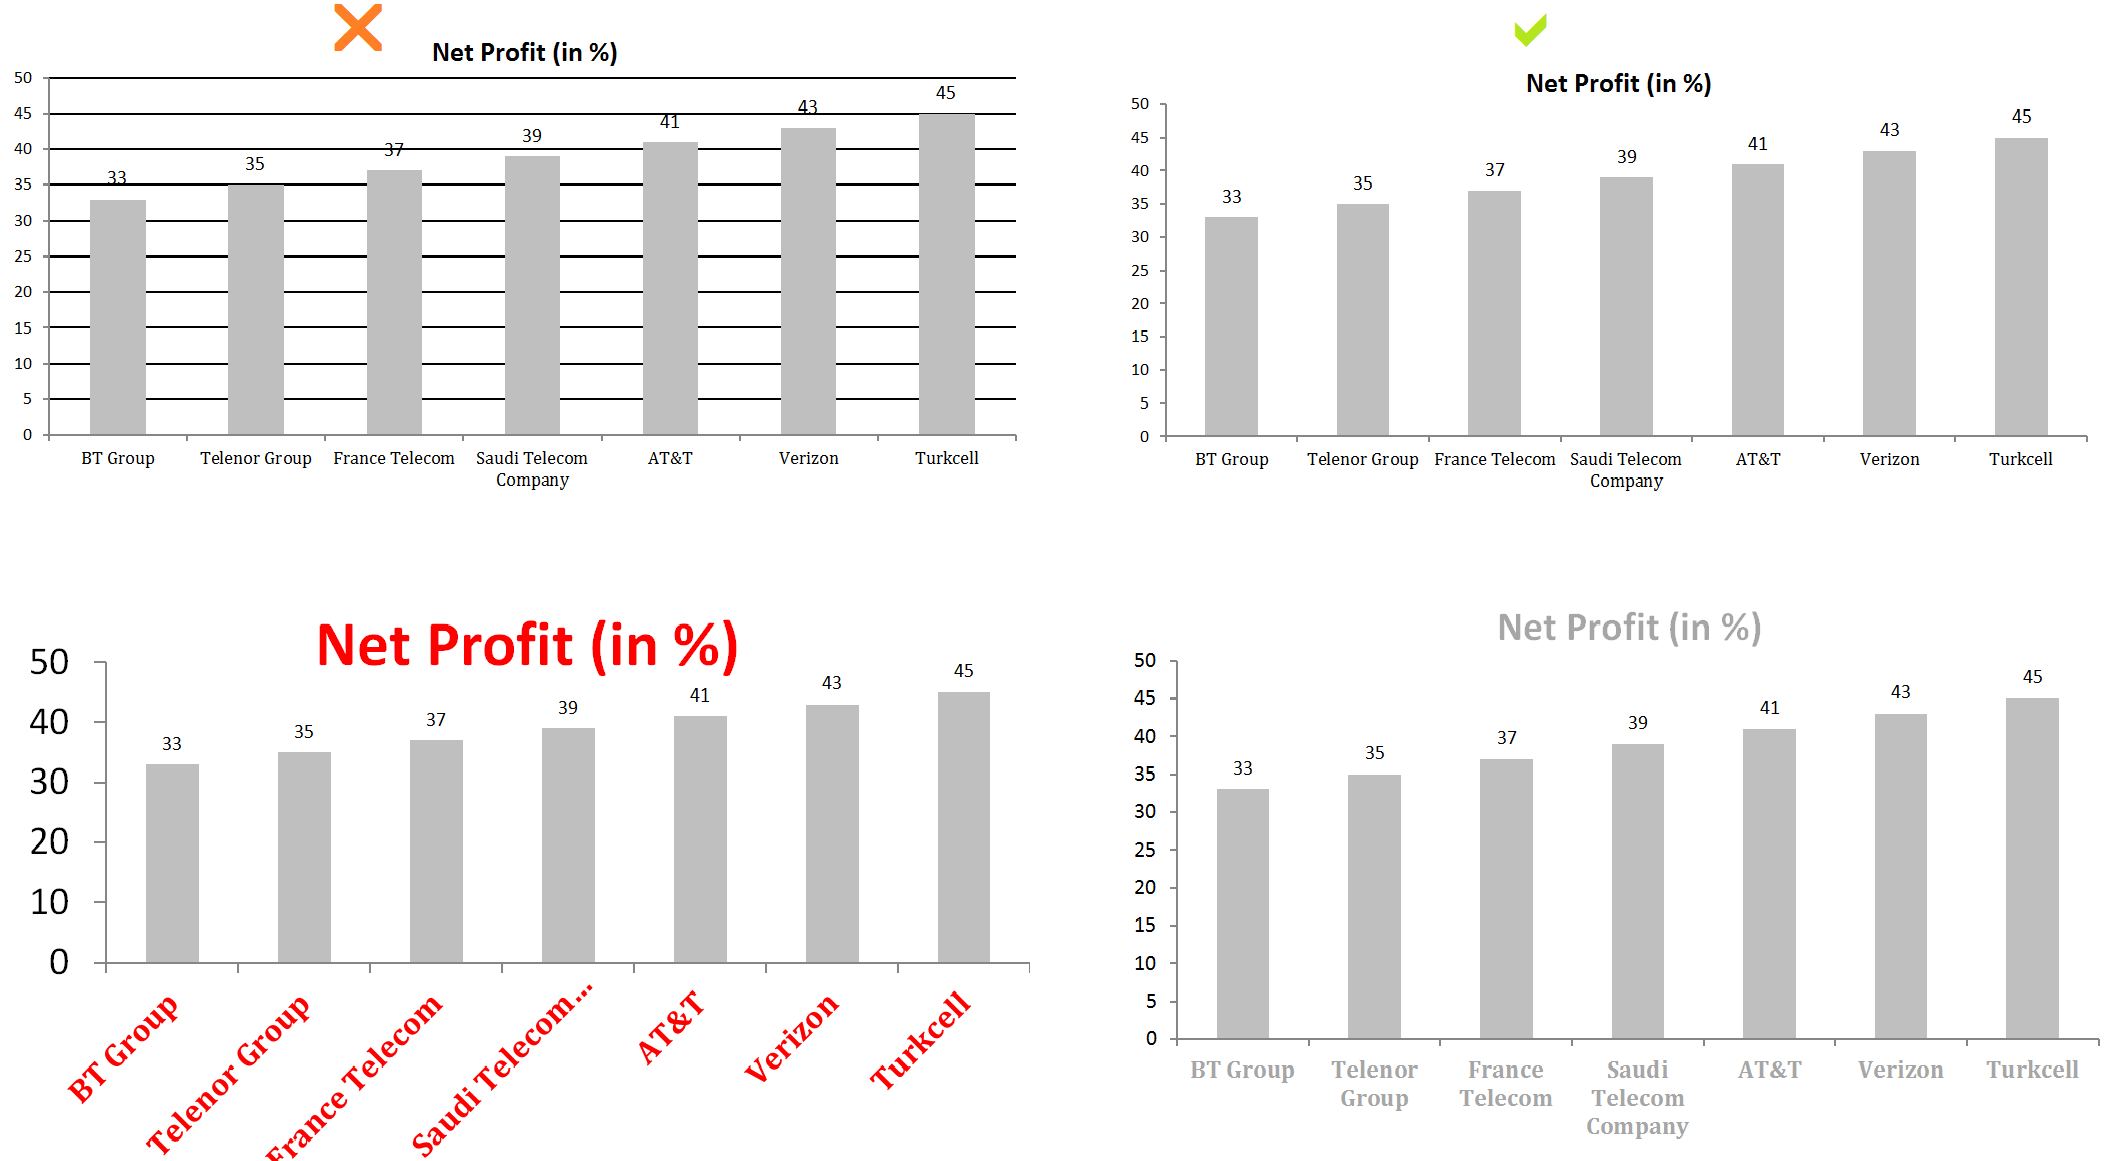
Plot Color and Chart Color in the Chart below is Chart Junk
Use Same colors unless they represent a difference subject or topic
Every bar in chart below represent Net Profit%, so there is no need to color them differently
Use softer / lighter colors for your charts. Use bright colors to highlight or to make something stand out.
In the first chart below see how Saudi Telecom Company stands out from the rest
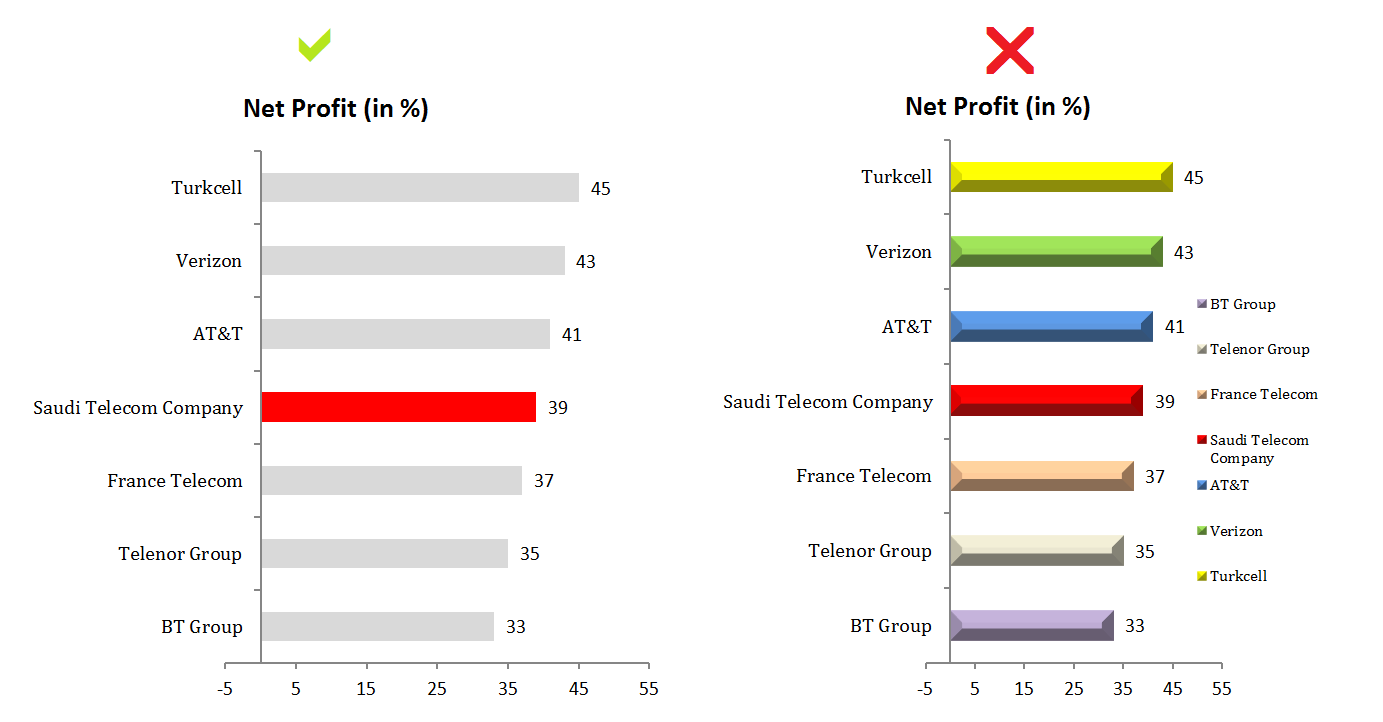
Stephen Few, the renowned Guru in Data Visualization writes that
“I frequently come across dashboards that display nearly everything in a visually salient manner. Bright colors,3-D effects, dark borders, and other visual attributes are turned up to such a high level that my eyes can’t decide where to look because everything competes for my attention. When everything is yelling, no voices stand out, and the result is noise that no one wants to hear.”
See how in 2nd chart above, every company is yelling for attention
“If everything is important, then nothing is.” ― Patrick Lencioni
“A Chart that calls attention to itself pictorially is almost surely a failure“ — (Howard Wainer, “Visual Revelations”)
2) CHOOSE APPROPRIATE CHART TYPE
Line Chart vs Column Charts
Line charts are the best when it comes to depicting trends over time, Column Charts(Vertical Bars) can be used for depicting trends over short time interval but over long time periods they can be problematic
Dr. Smith writes that “You’ll find that when you look at a column chart that tracks performance over a long period of time, you are mentally tracing an imaginary line along the tops of the columns to discern the trend. Line charts do a much better job of showing trends over time”
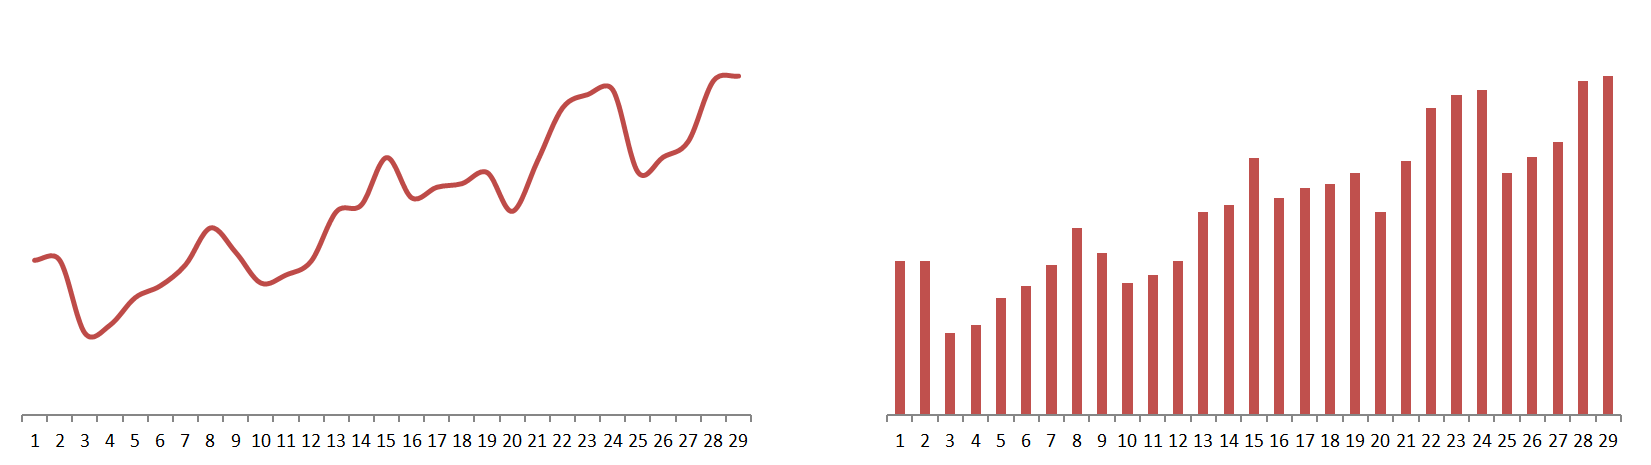
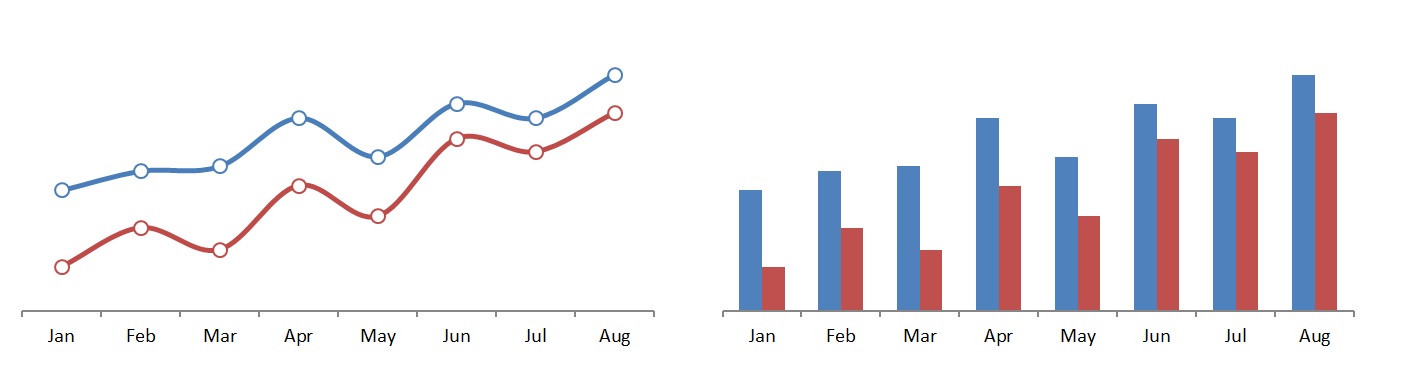
If there are 2 or more trend series, never use a Column Chart
Column Charts Vs Bar Charts
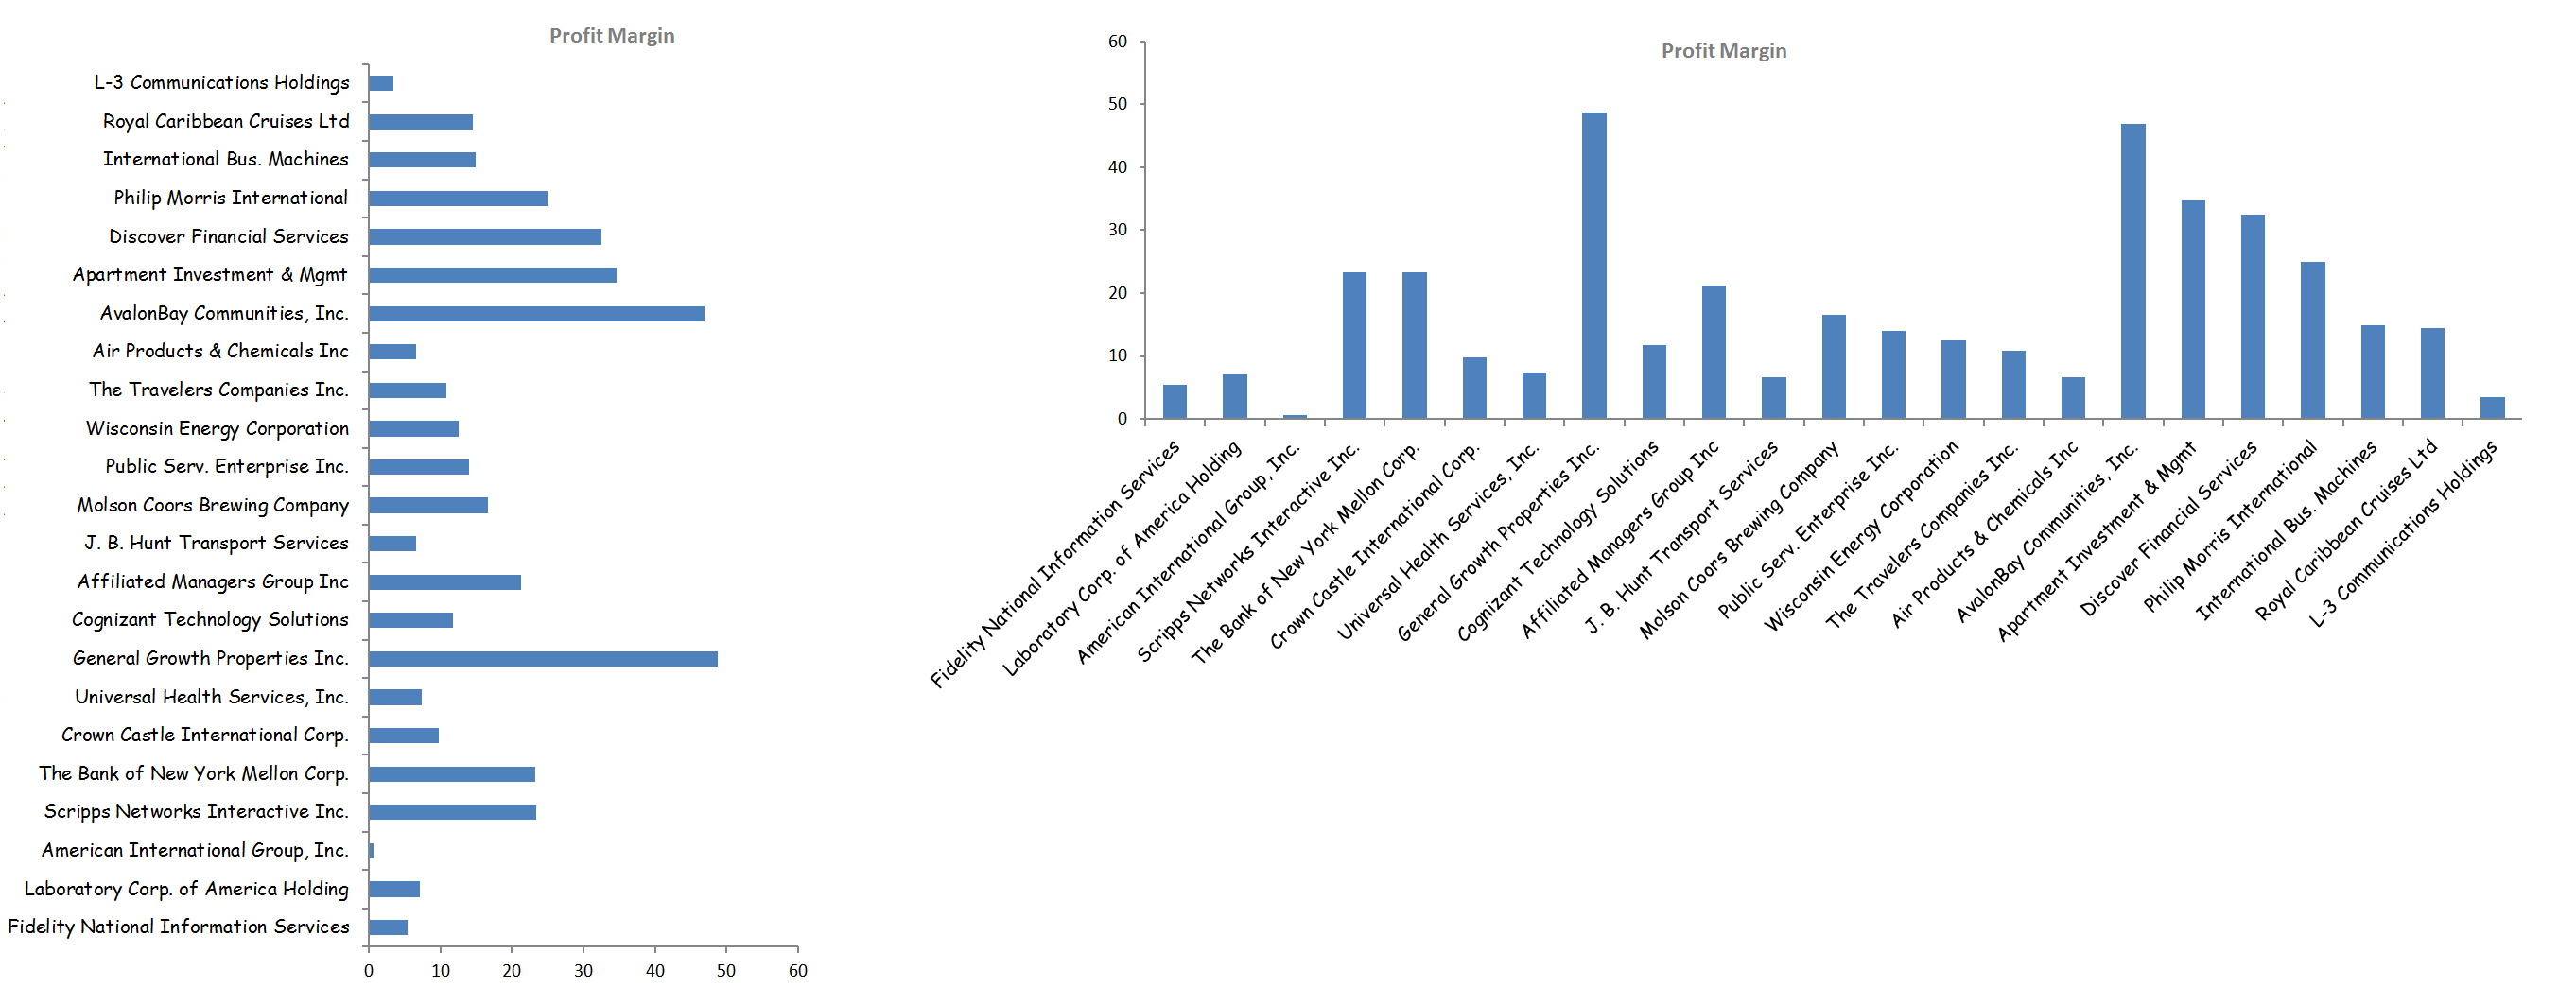
Column charts (Vetical Bars) / Horizontal Bar charts are best for comparing the relative size of discrete/distinct categories. You can choose either of the two.
However if the category labels are long, use bar chart
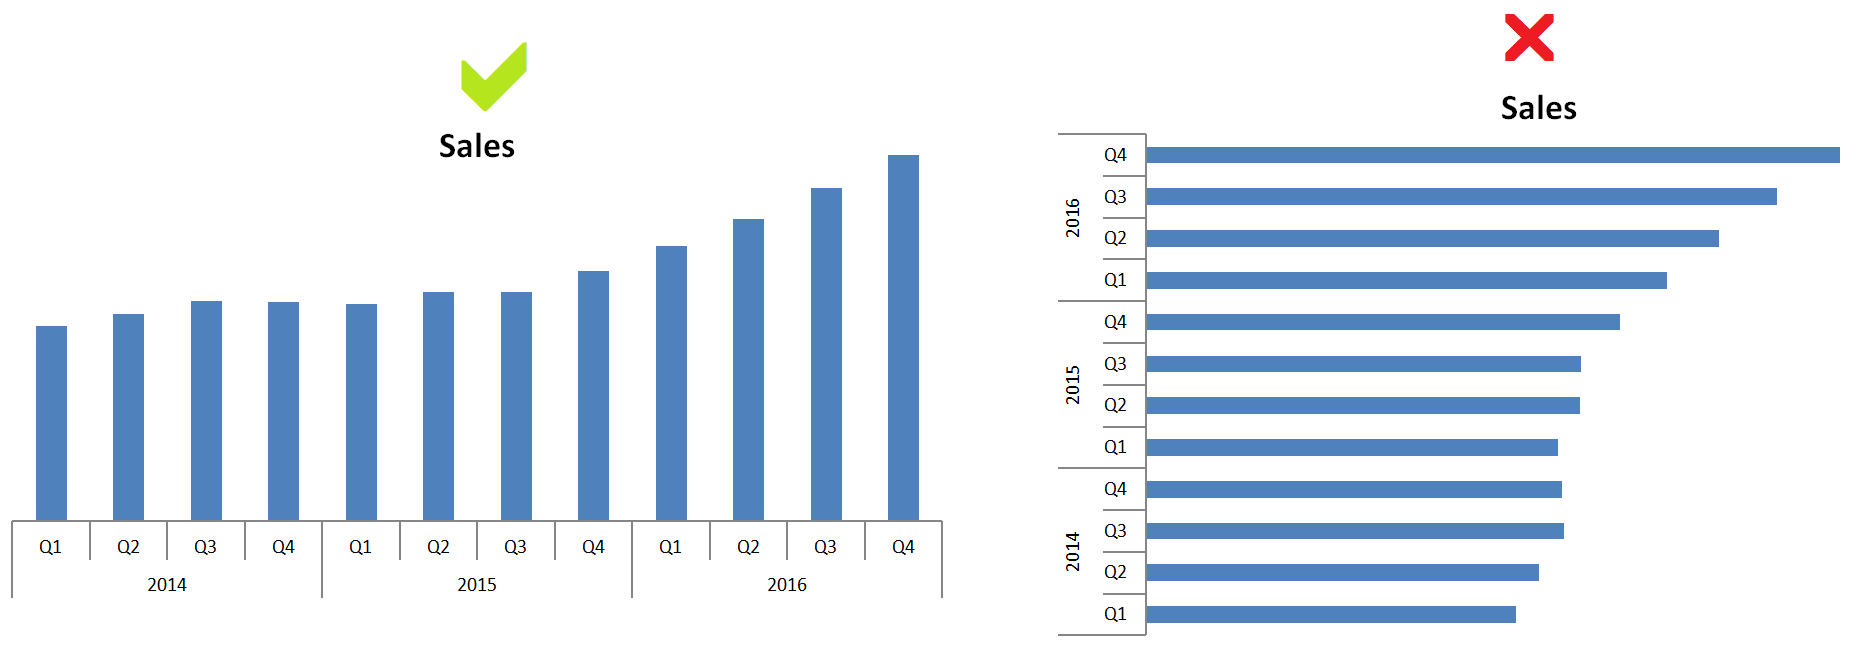
Never use Bar Charts for depicting trends. Column Charts can be used for depicting trends especially over short time periods (say up to 9 bars)
PIE CHARTS
Use Pie Charts (and their cousins like Donut charts) rarely……. extremely rarely.
Pie charts are intended to show the part to whole relationship. However they have a major disadvantage in that they make it very difficult to compare the relative size of slices. Te figure below illustrates this problem
The two charts below show the net worth of top 10 riches people in the world. Who is the richer between Warren Buffet and Jeff Bezoz? Who is the richer of Mark Zuckerberg and Larry Ellison? Which chart makes it easier to answer these questions
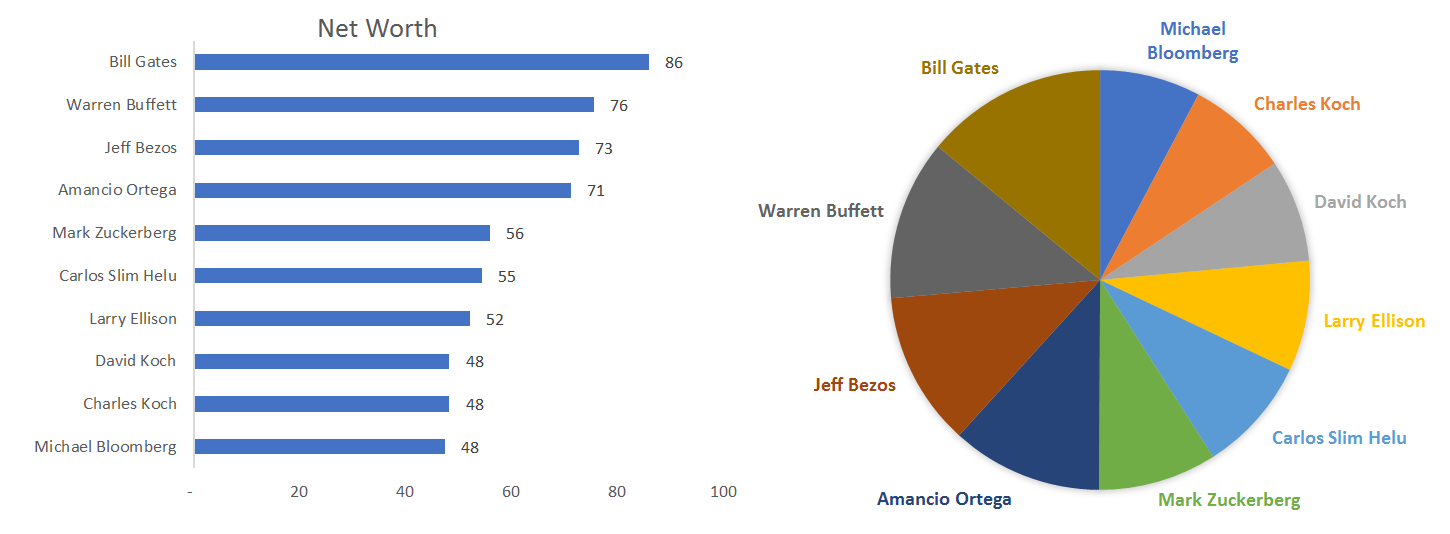
To quote some experts
“A table is nearly always better than a dumb pie chart; the only worse design than a pie chart is several of them” — Edward Tufte
“Of all the graphs that play major roles in the lexicon of quantitative communication — pie chart is bar the least effective. Its colorful voice is often heard but rarely understood. It mumbles when it talks” —- Stephen Few
Here is one very interesting article by Stephen Few on Pie Charts http://www.perceptualedge.com/articles/visual_business_intelligence/save_the_pies_for_dessert.pdf
3) OTHER CHART JUNKS
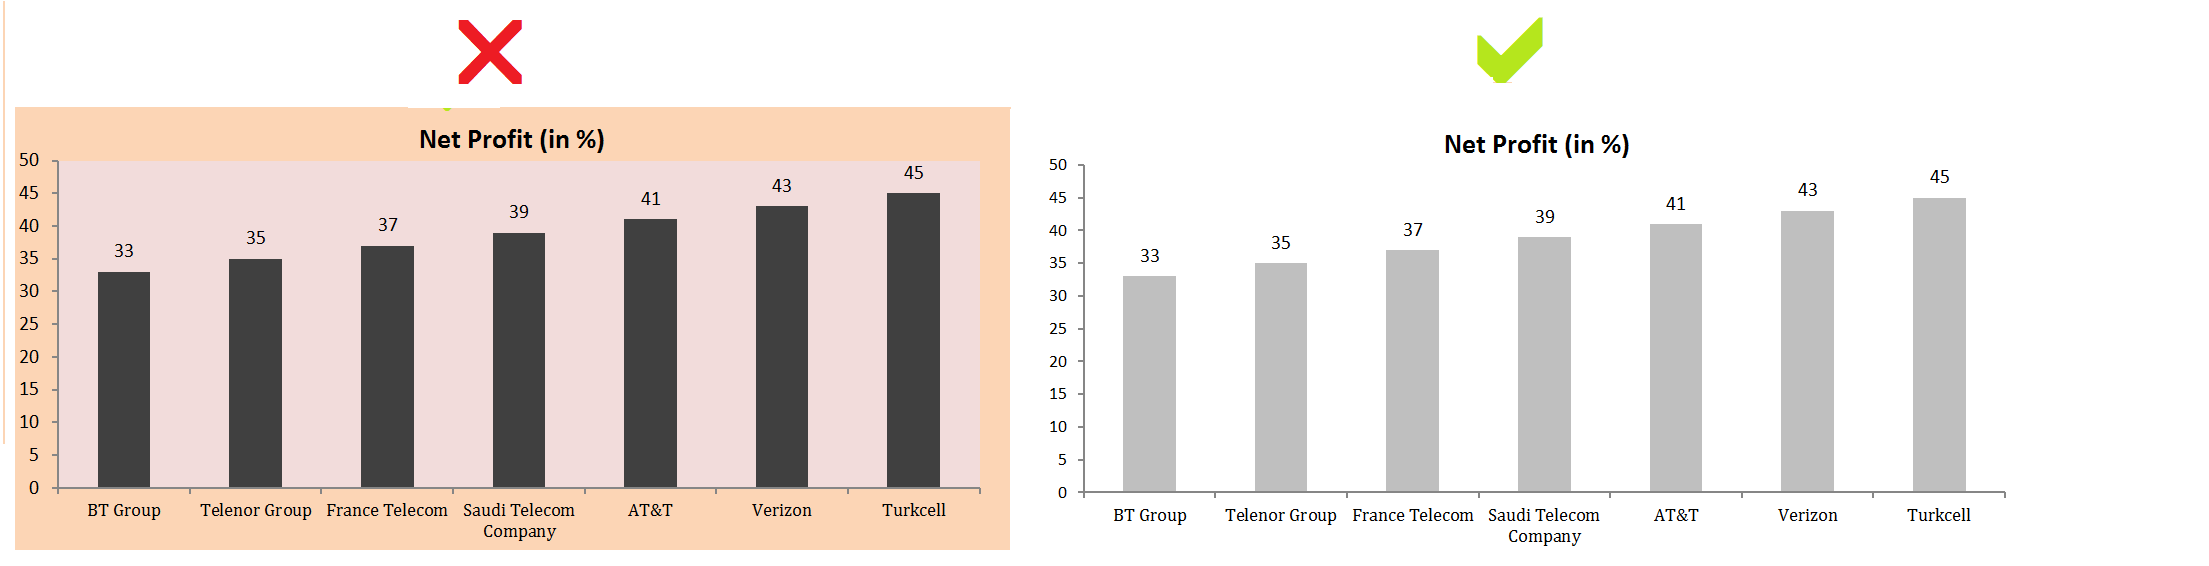
Gridlines and Font Size
Gridlines rarely add additional value to the chart. Large Font Size for Chart Titles, Category and Value Axes Lables attract attention and distract from data. Remember Tufte’s advice
“Above all else show the data”
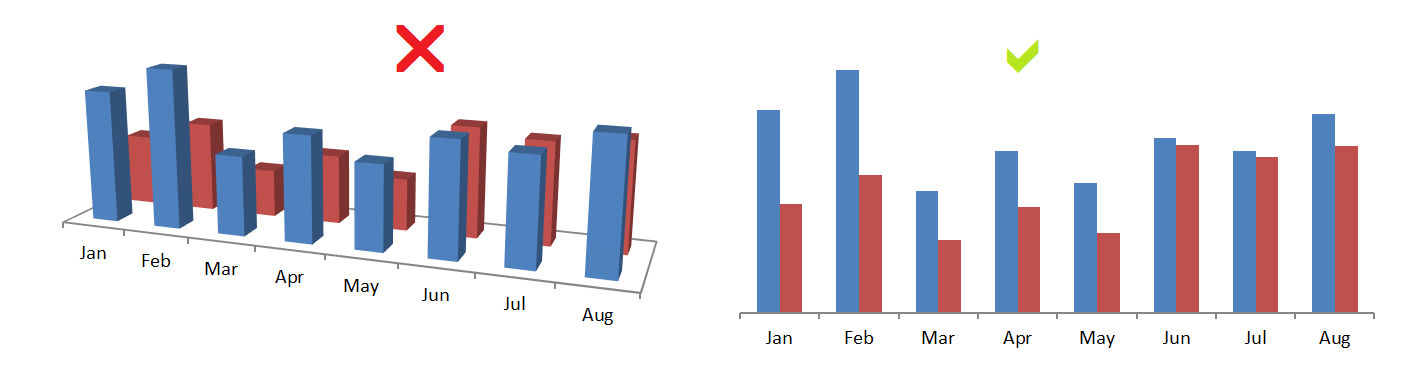
Don’t use 3D ELEMENTS
Gerald Jones in is Book “How to Lie with Charts” writes that
” It’s virtually impossible to make a 3D chart that doesn’t give a wrong impression”
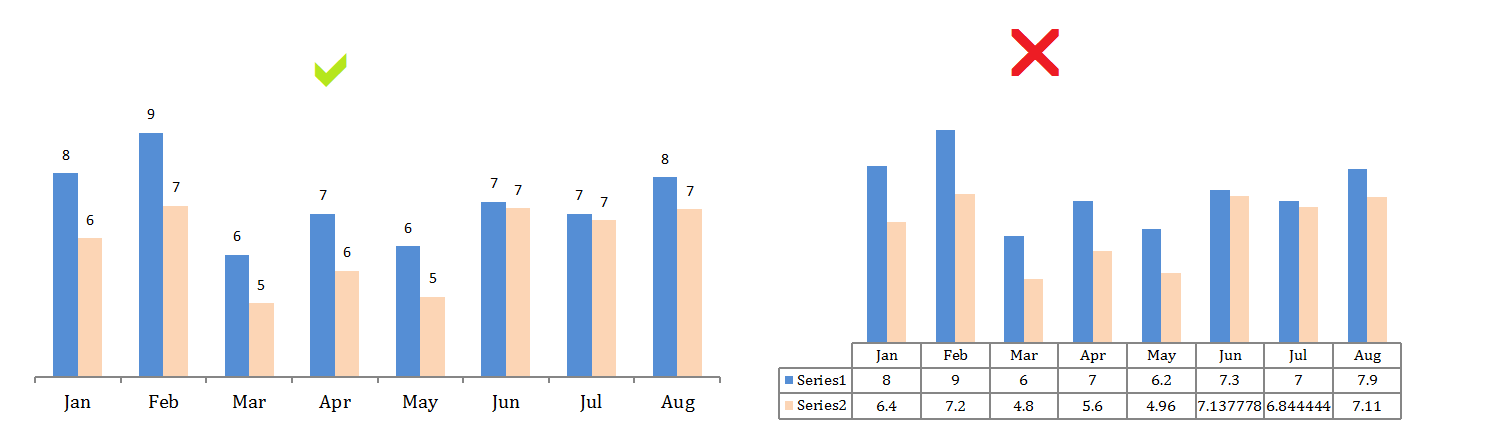
Note how 3D Column chart misrepresents the data for months of Jun and Jul (Red bars appear to have higher values than blue when in fact they are lower)
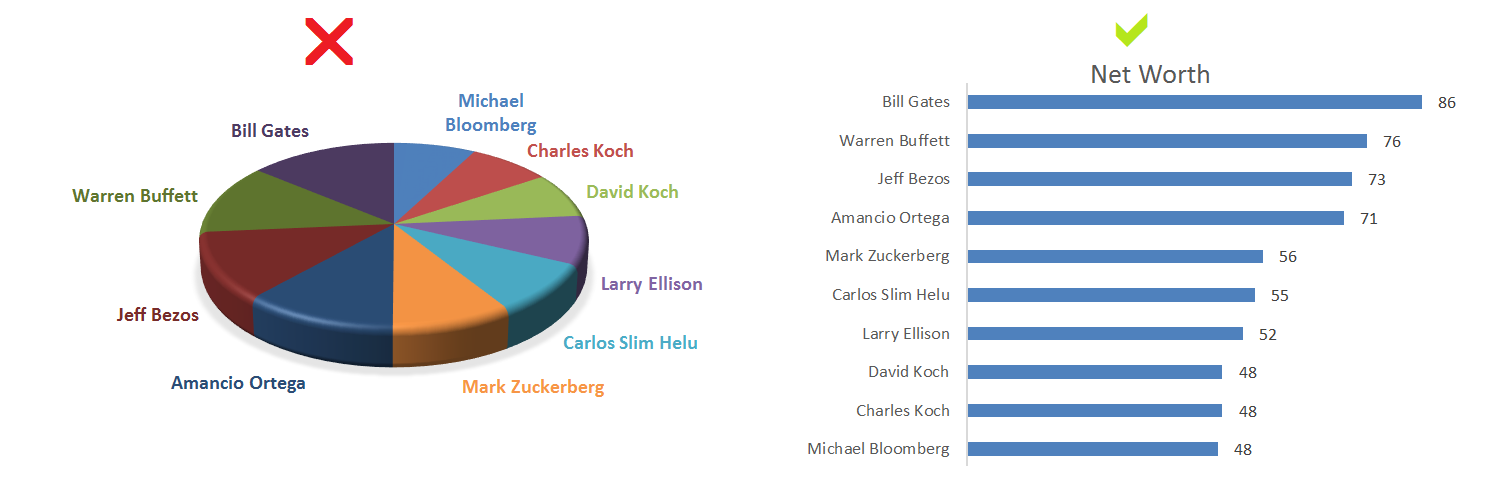
Note how in the 3D pie chart below Mark Zuckerberg and Amancio Ortega appear to have higher net worth than Bill Gates when in fact their net worth is quite lower
Use Data Labels instead of Data Table
Data Tables require viewers to move their eyes back and forth between bars and table. This unnecessary mental effort could be avoided by labeling the bars directly. Also see how they take away precious space in a chart.