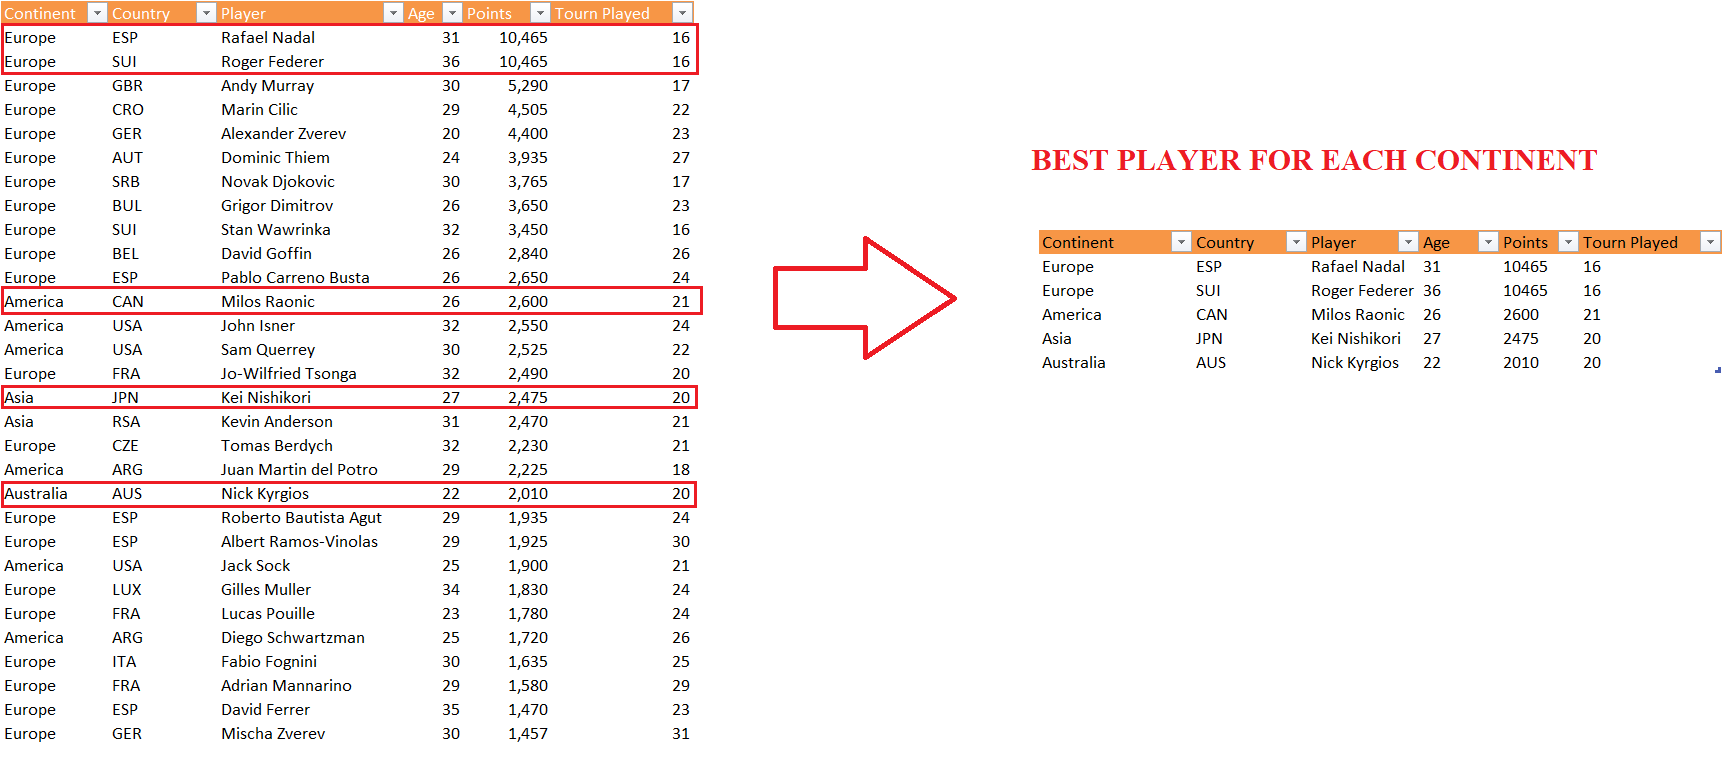
Here is the data of Top 30 tennis players in the World from 5 different Continents
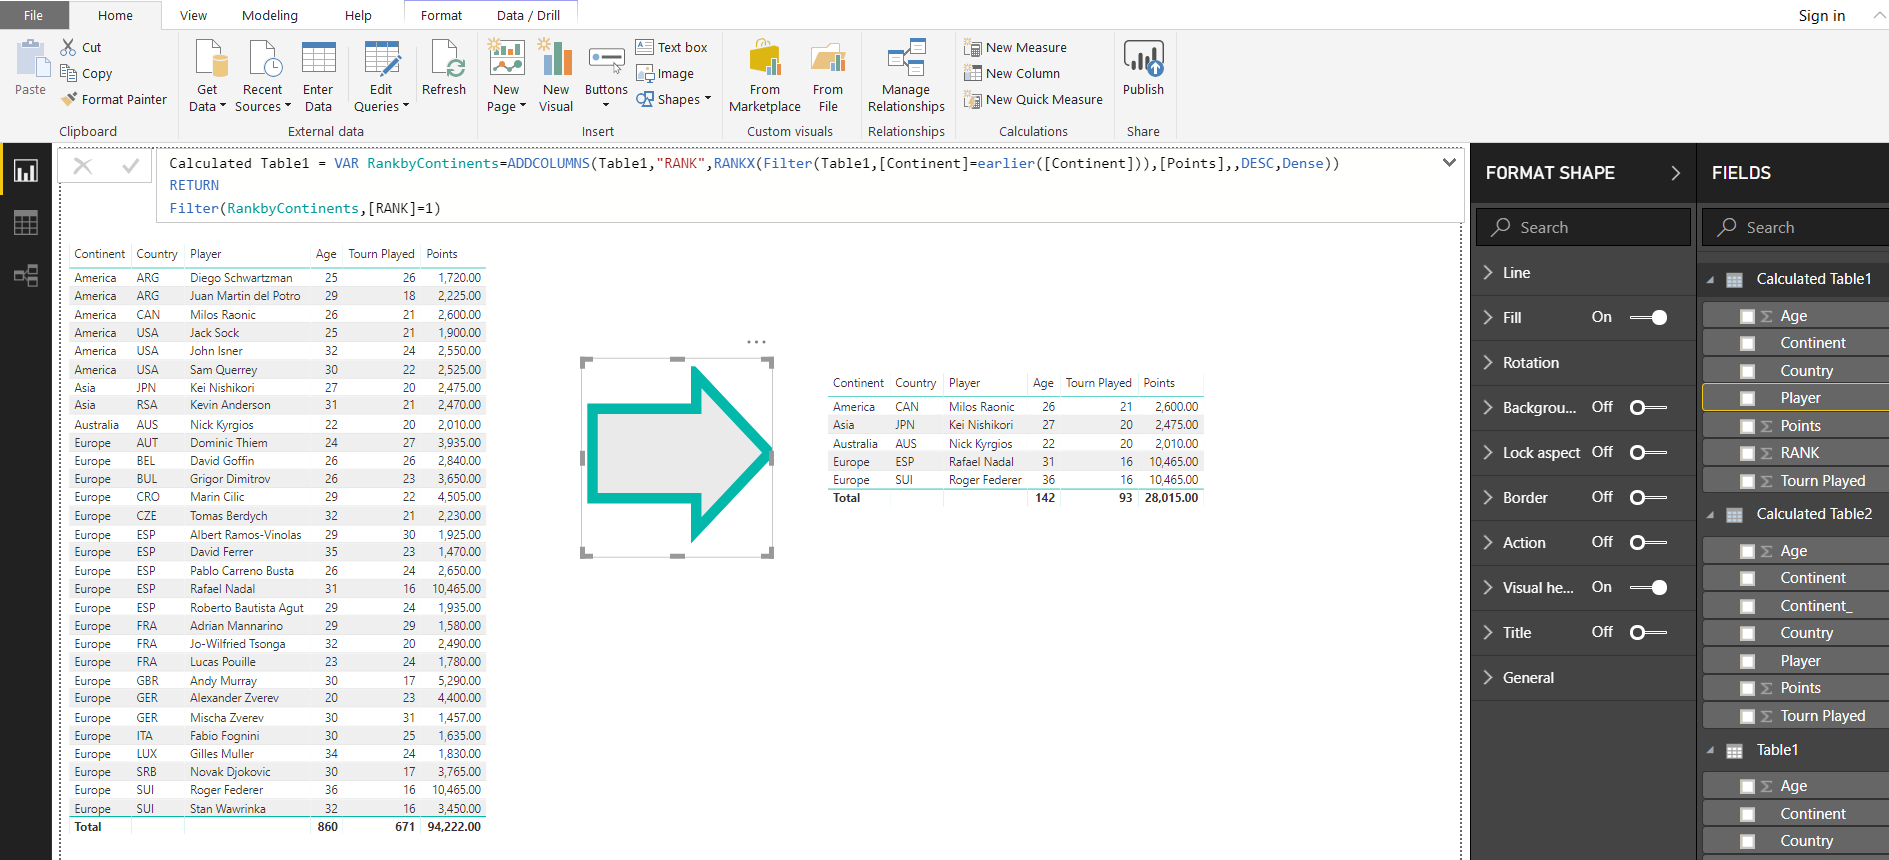
Our Objective is to get the Best Player for each Continent with all his details as shown in the Image below
Data from https://www.atpworldtour.com/en/rankings/singles
POWER QUERY / QUERY EDITOR / M
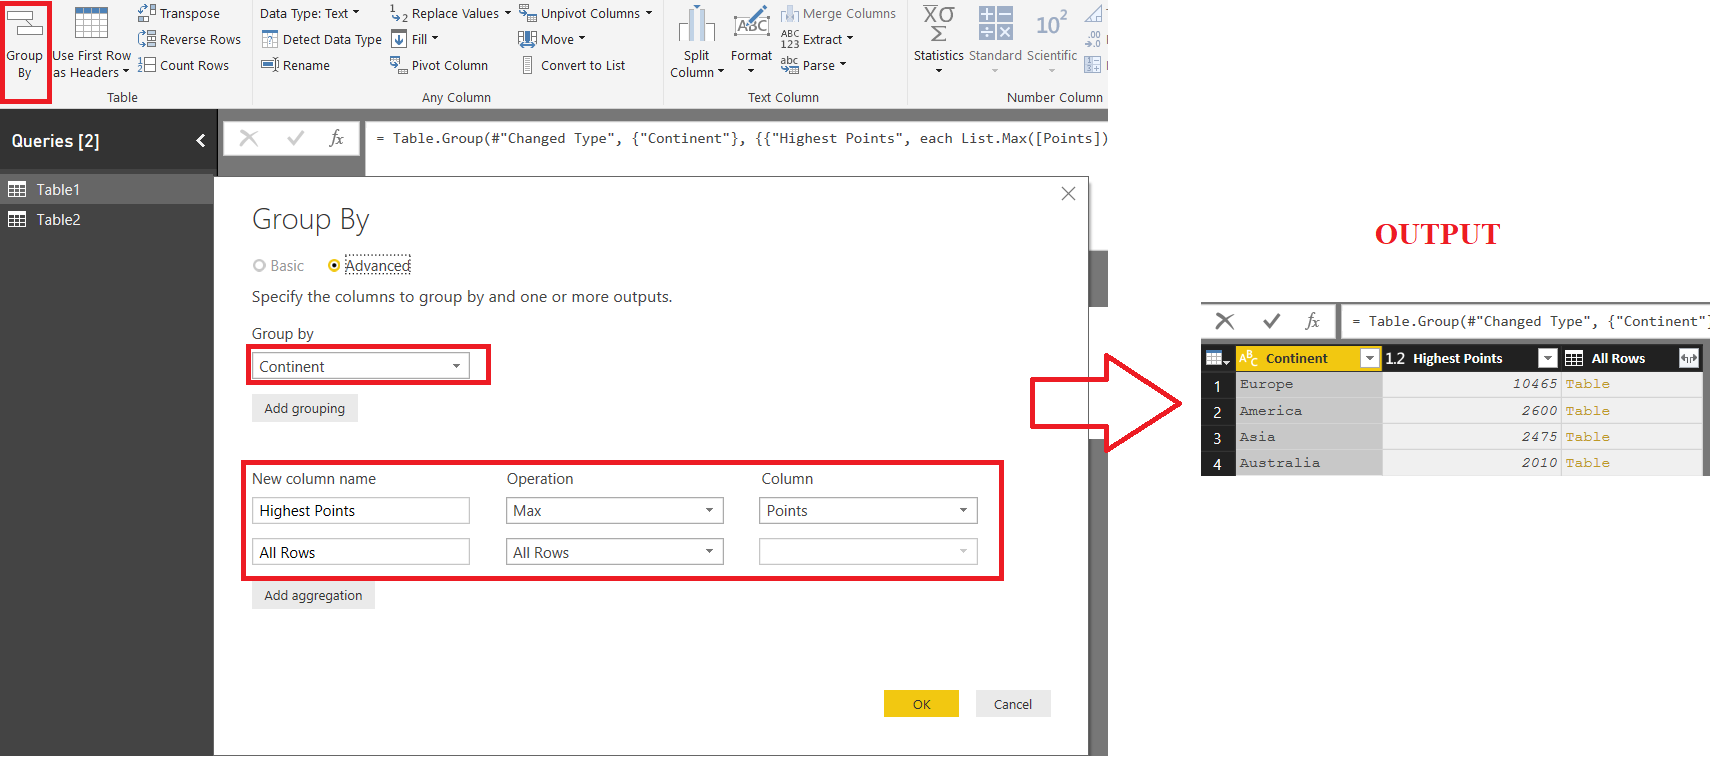
Step#1: Go to Transform Tab >>Group BY as shown in the image below
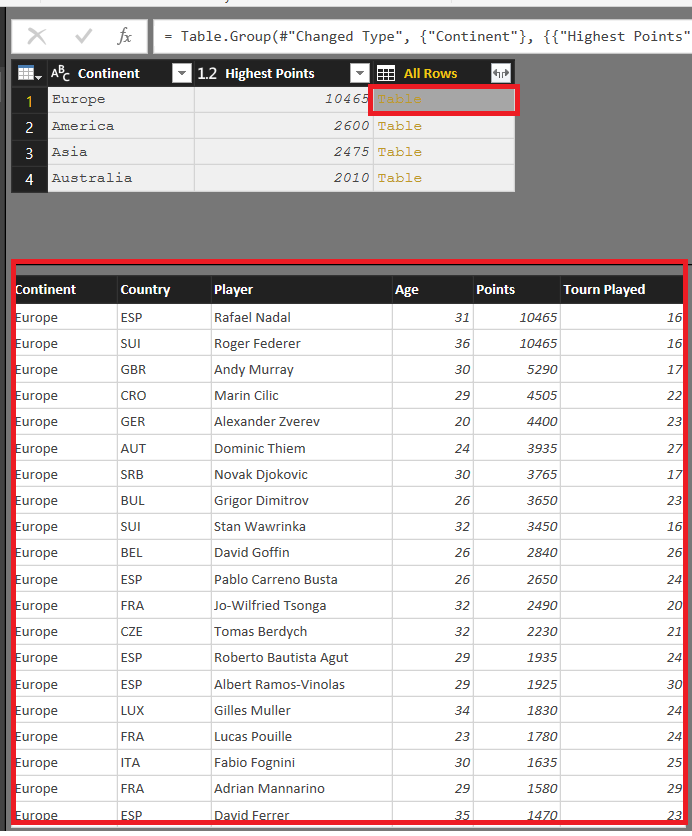
If you select any Table from the “ALL ROWS” column, it will give you a preview of the Table Rows related to that Continent.
This is shown in image below
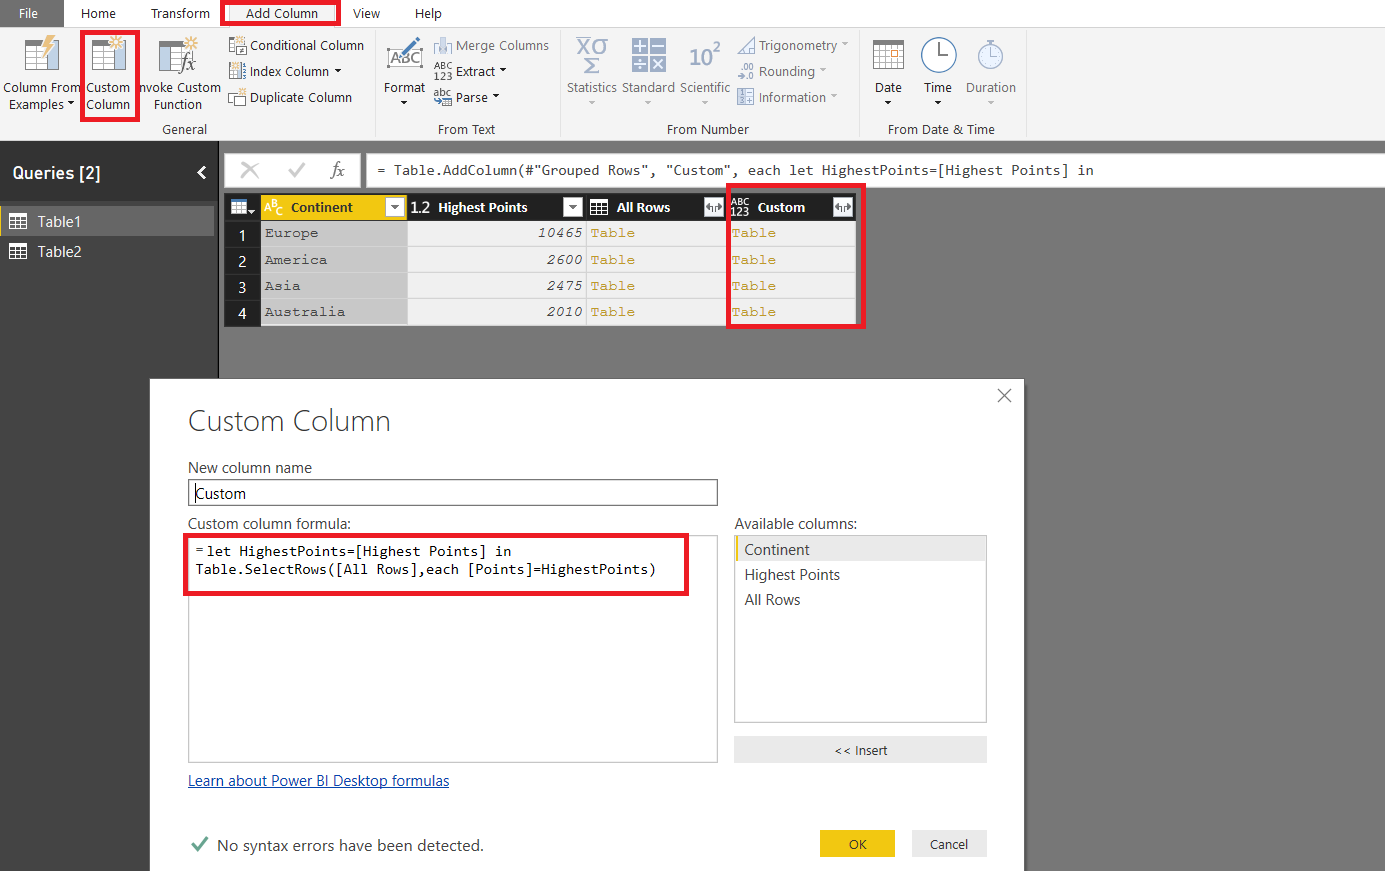
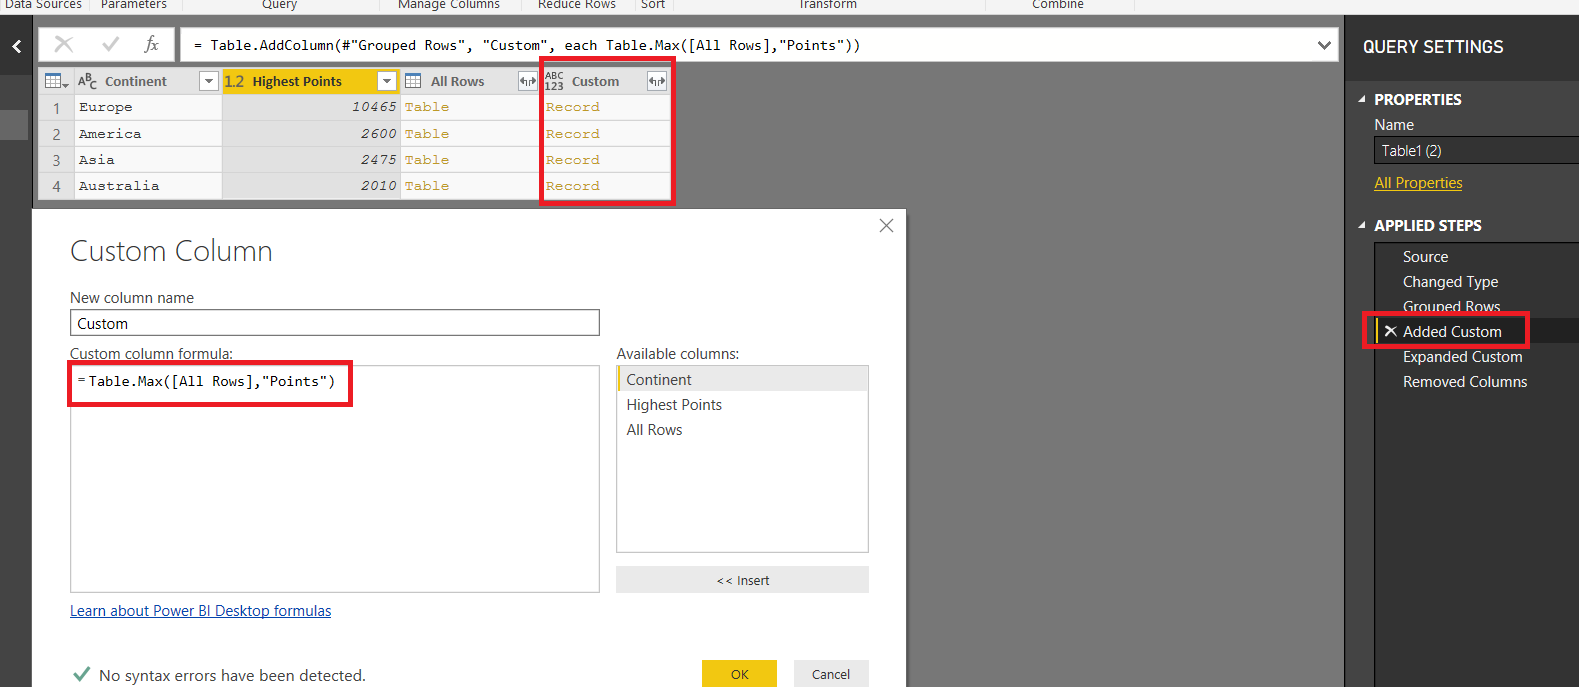
Step#2: Our Objective is to get the Rows where the Points are equal to the Highest Points for that Continent
For this, we add a custom Column from the “Add Column” Tab to select relevant rows only
Step#3: Now we can simply expand this Custom Column to get the Desired Columns and Delete the unnecessary ones
ANOTHER WAY IN POWER QUERY
Another way to use Table.Max function in Step 2 above. However note that when you use Table.Max function only one record is returned for Continent Europe (Both Roger Federer and Rafael Nadal have same points but only Roger Federer’r row is returned
USING DAX / CALCULATED TABLE
-
FIRST APPROACH:
CROSSJOIN continents with their respective TOP 1 rows using TOPN function
Go to Modelling Tab>>New Table and enter the following formula
Calculated Table =

GENERATE (

    SELECTCOLUMNS ( VALUES ( 'Table1'[Continent] ), "Continent_", [Continent] ),

    CALCULATETABLE ( TOPN ( 1, 'Table1', [Points], DESC ) )

)
-
SECOND APPROACH:
Another Approach could be to RANK the Points for each CONTINENT and then filter out the RANK 1
So the following Calculated Table would also work
Calculated Table =

VAR RankbyContinents =

    ADDCOLUMNS (

        Table1,

        "RANK", RANKX (

            FILTER ( Table1, [Continent] = EARLIER ( [Continent] ) ),

            [Points],

            ,

            DESC,

            DENSE

        )

    )

RETURN

    FILTER ( RankbyContinents, [RANK] = 1 )
-
THIRD APPROACH:
A third approach could be to get the a summarized Table with MaxPoints for each Continent and then use it to filter original table
Calculated Table 3 =
VAR TOPROWS =
GENERATE (
VALUES ( ‘Table1′[Continent] ),
VAR mytable =
CALCULATETABLE ( TOPN ( 1, ‘Table1’, [Points], DESC ) )
RETURN
SUMMARIZE ( mytable, [Points] )
)
RETURN
CALCULATETABLE ( Table1, TOPROWS )
-
FOURTH APPROACH:
Quite Similar to third approach. However note that in this case we cannot directly use TOPROWS table as FILTER expression since Data Lineage is broken.
Calculated Table 4 =
VAR TOPROWS =
SUMMARIZE (
Table1,
[Continent],
“Points”, CALCULATE ( MAX ( Table1[Points] ) )
)
RETURN
CALCULATETABLE (
Table1,
TREATAS ( TOPROWS, Table1[Continent], Table1[Points] )
)
Do you know another approach? Please share with me
DOWNLOAD
Download the Pbix files below and play with formulas to learn