In this post I am going to show you a simple but yet very informative Excel Dashboard constructed using Conditional Formatting Data bars and little bit VBA
Click here to Download this file
I will briefly describe the techniques here
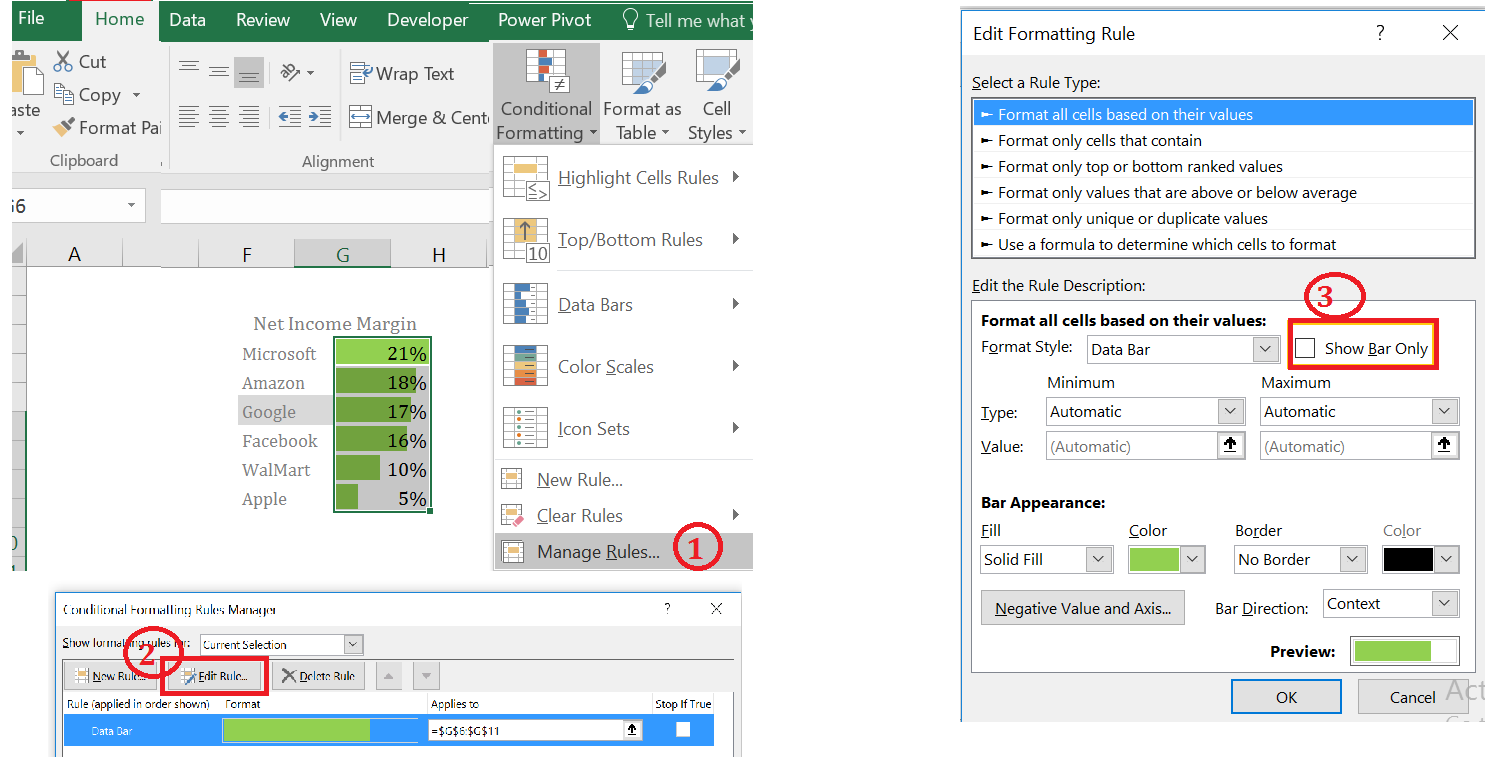
- DATABARS

Many people use conditional formatting databars where the figures are shown inside databars. This is the default way Excel creates databars.
With very little effort you can make your dashboard aesthetically pleasing
Select the area you have conditionally formatted. Go to HOME>>Styles>>Conditional Formatting>>Manage Rules>>Edit Rule. Then select the checkbox “Show Data bar” Only. This is shown below
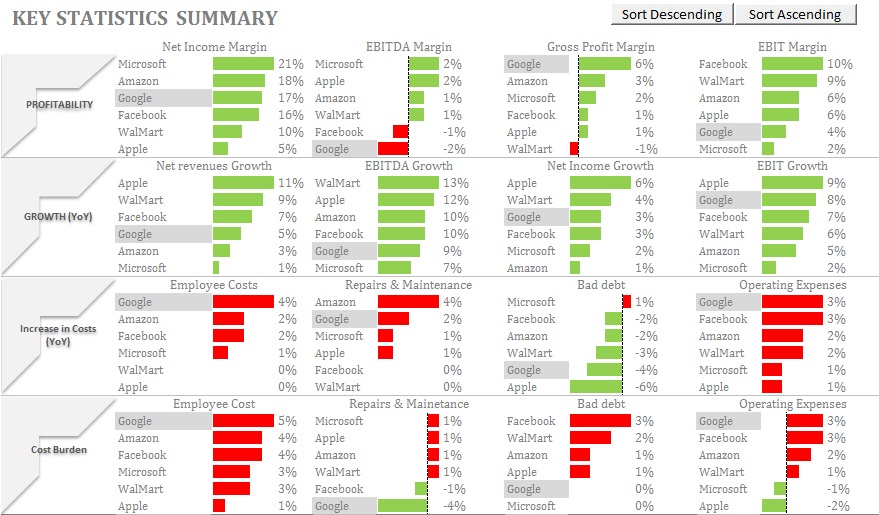
USE ANOTHER CONDITIONAL FORMATTING TO FOCUS ON ONE ENTITY
As shown in the animated image below I have a listbox with list of entities. When an entity is selected in the listbox, the entity name in the Dashboard gets highlighted. This is very useful to see the rank of a particular entity in terms of various measures. This is also done using conditional formatting
SORTING OF KEY STATISTICS
Also the Dashboard includes 2 form controls (command buttons) which are used to sort the Key Statistics from largest to smallest or from smallest to largest.
You can see the VBA code by going to VB editor