- Overview of Hierarchical Bar Chart
- How to Use this Visual/ Key Features
- Formatting Options
- Download
- Purchase of Premium Features
OVERVIEW
Hierarchical bar chart is a Power BI Custom Visual which displays hierarchical data (different fields having parent/child relationship) in the form a bar/column chart with +/- signs to view/hide details or child elements.
This visual has following key features
- Show variance between bars
- Drag the bars for custom sorting
- Expand/ Collapse bars using (+/-) buttons
- Click on legends to drill down/up to any level
- Show targets
It is a free Custom Visual but with certain premium features requiring additional purchase.
This short video gives an overview of this visual’s features.
HOW TO USE THIS VISUAL / KEY FEATURES
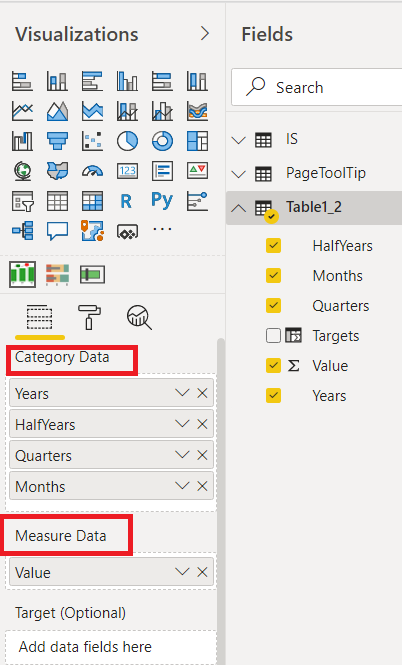
This visual needs at least one field in the “Category Data” segment and one field in the “Measure Data” of the fields pane.
You can use a maximum of 4 fields in the Category Data.
Take text fields having parent/child relationship (for example Continents|Countries|Cities or Years|HalfYears|Quarters|Months) and drag them to the Category Data .
Drag the Measure or numeric field to Measure Data
Download the pbix file to see sample use cases
Following are the key features of this visual
1) VARIANCE BETWEEN BARS
Page TopYou can show variance between any two bars by clicking them one after another. To remove the variance , double click the variance circle.
You can define colors for positive and negative variances from the formatting pane>>Variance Colors
Now you can add CAGR between the bars as well. Just turn on CAGR from the format pane and click the bars one after another to add CAGR. This is depicted in short video below
2) Collapse/Expand bars using +/- signs at the bottom of chart to view /hide details
3) Drag the bars to sort them as you like
Page TopYou can drag the bars to perform a custom sorting. This can be very useful in some cases for example visualizing “Income Statement” items which do not follow an alphabetic order.
On each drag, 2 bars switch their position. So if the first bar is dragged to last bar, the last bar will become the first bar and vice versa.
The visual remembers your custom sorting even if you close the pbix file or switch between pages.
To turn off the custom sorting and switch to default sorting just the press “refresh button’ at the top right of visual.
4) Click on legends to drill down/up to any level in the hierarchy
Page TopWhen you drill down or up, the VISUAL still remembers your settings such as “Variances you created” and “expand/collapse” status of the bars
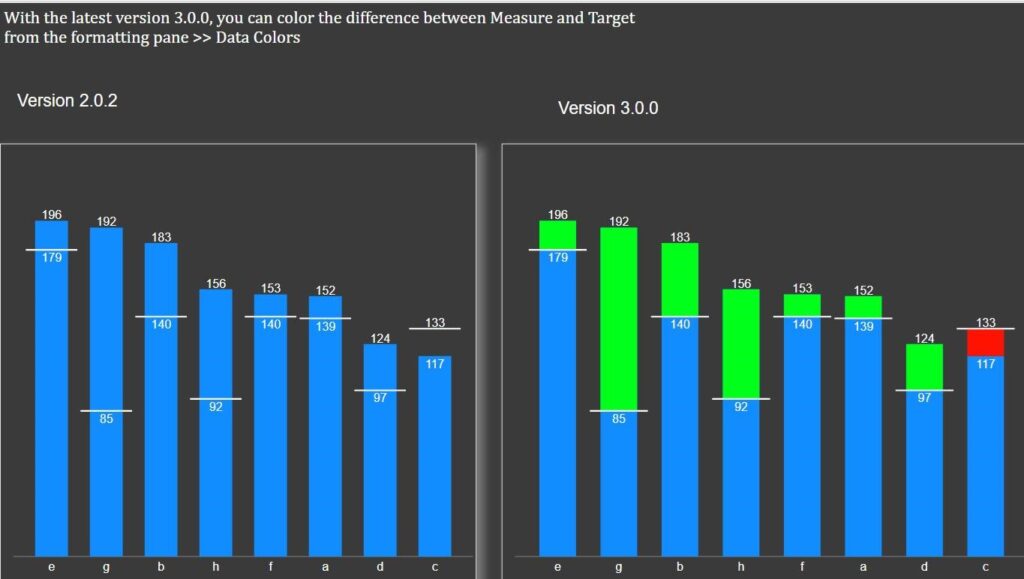
5) Show Targets
Page Top
You can color the difference between Measure and Target from formatting pane>>Data Colors
FORMATTING OPTIONS
1 ) X-Axis Formatting
Page Top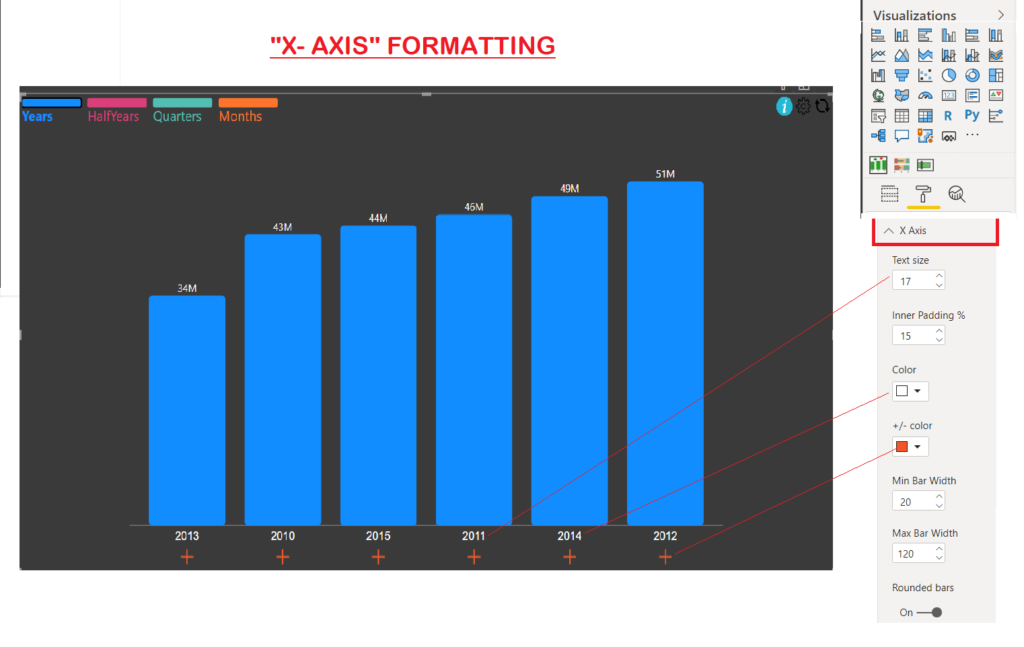
Min Bar Width and Max bar width respectively ensure that bar width is not too thin when there are many data points/bars and that bar is not too wide when there are only few bars to show for example try filtering above visual to shown only 1 or 2 bars.
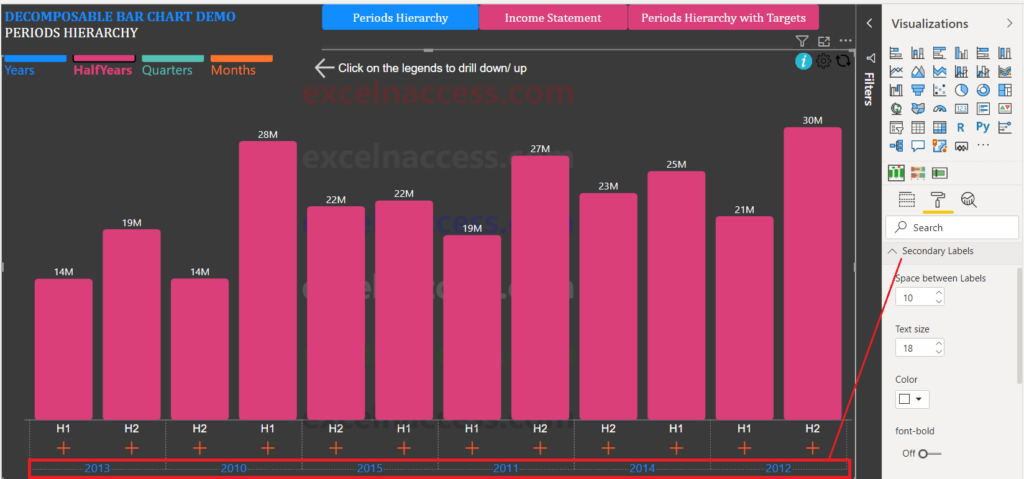
Page Top2) Secondary Labels Formatting
When you drill down to any lower level, that data bars are grouped by each of the previous level’s name. The image below shows level2 “HalfYears” of the hierarchy Grouped by Level1 “Years”
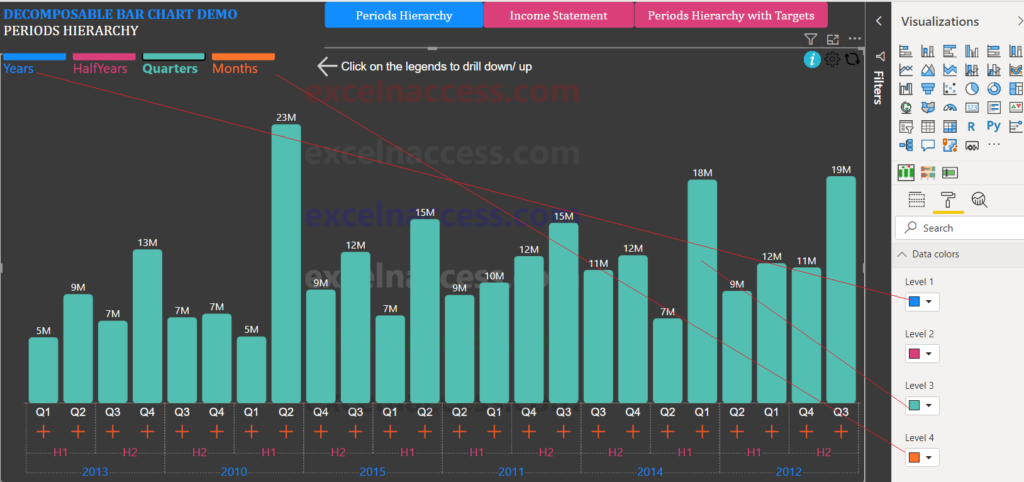
3) Data Colors
You can change the Color of the bars at each level. Color is reflected in the bars, legends, secondary labels.
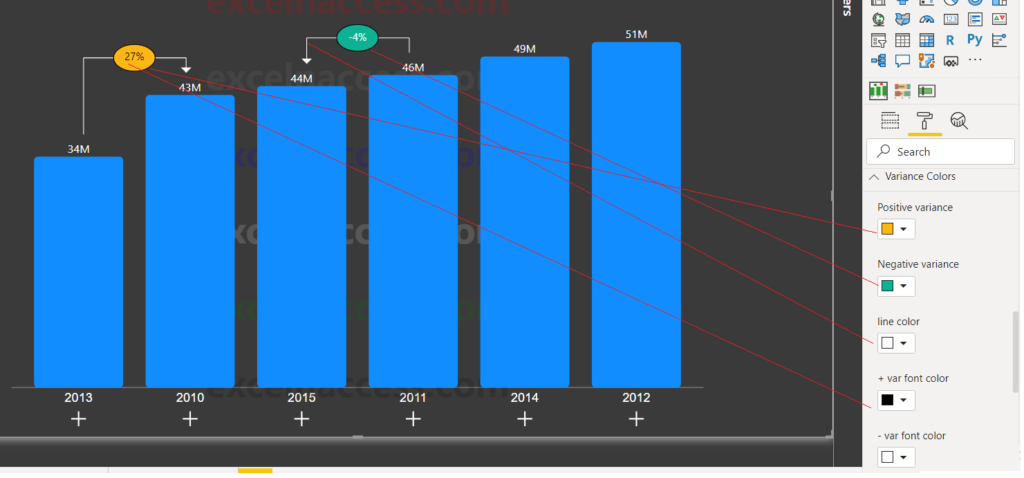
4) Variance Colors
You can change the variance oval background and font color etc. as shown below
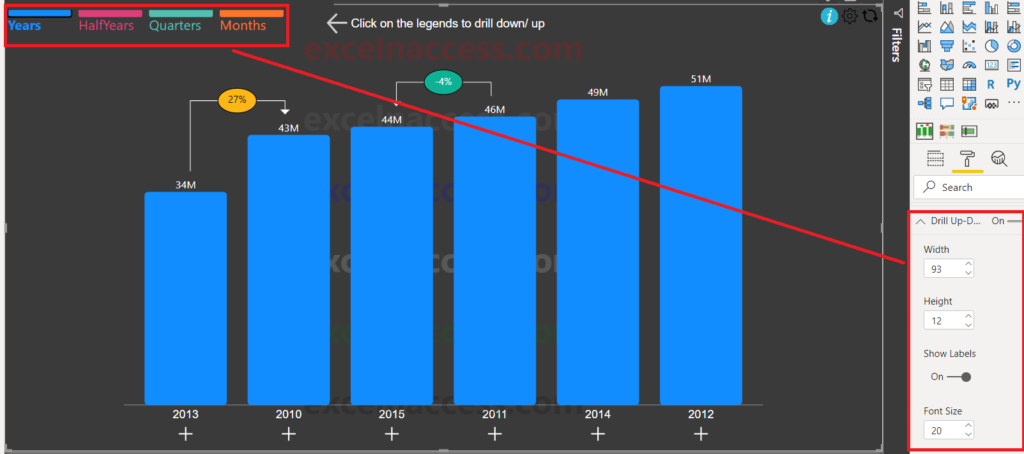
5) Drill Up-Down
You can format the legends (which can be used to drill down/up to any particular level) using this segment in the property pane
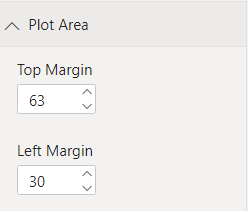
6) Plot Area
Plot area can be used to add/ reduce space at the top and left side of bars for showing variances and y-axis respectively
Other formatting options are
7) Y-Axis
8) Data Labels
9) Targets
DOWNLOAD
Page TopYou can download this custom visual from Microsoft’s AppSource.
Click here to download sample pbix file
PURCHASE
To use the visuals without Watermark in Power BI Online, please purchase the Visuals’ license for a 1 year period. License key will be sent to your email ID. You can get the license key in next few hours.
If you don’t hear back from me, it is most likely due to email authentication problems or SPAM filters. In that case, please leave me a message on Twitter or Linkedin or WhatsApp me on +923333225816.
Have any questions or concerns? Please don’t hesitate to contact me at zubair@excelnaccess.com or WhatsApp me on +923333225816
LIMITED TIME OFFER
If you purchase license for unlimited users, you can get entire suite of 5 visuals for no additional cost. Also license period will be increased by 6 months for no additional cost