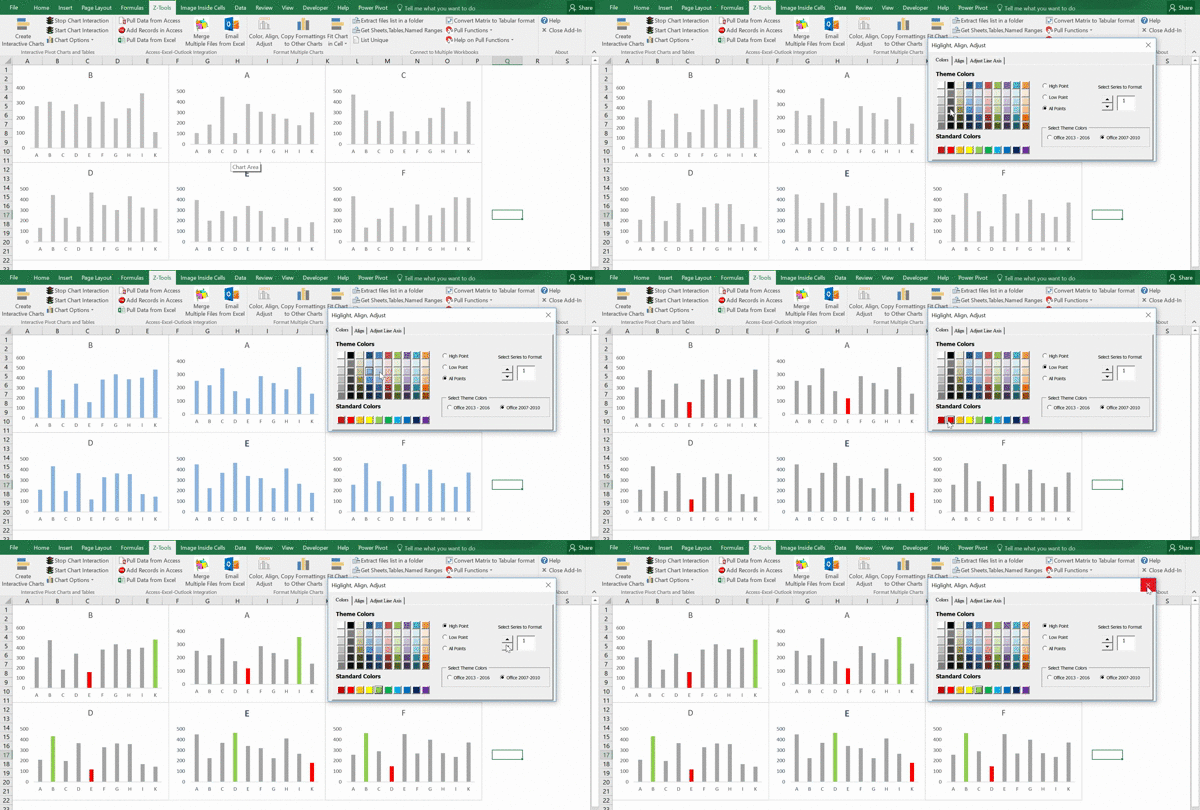
Excel does not provide an option to format multiple charts simultaneously. For example if you want to add data labels you have to manually select each chart and then add data labels. This can get really inconvenient if you have say 10 or more charts requiring similar formatting.
With this problem in mind, I added some tools which allow you to
- Copy formattings of one chart to other charts in the sheet,
- Align charts horizontally, vertically or both ways
- Change Chart Colors / Highlight charts points like in sparklines
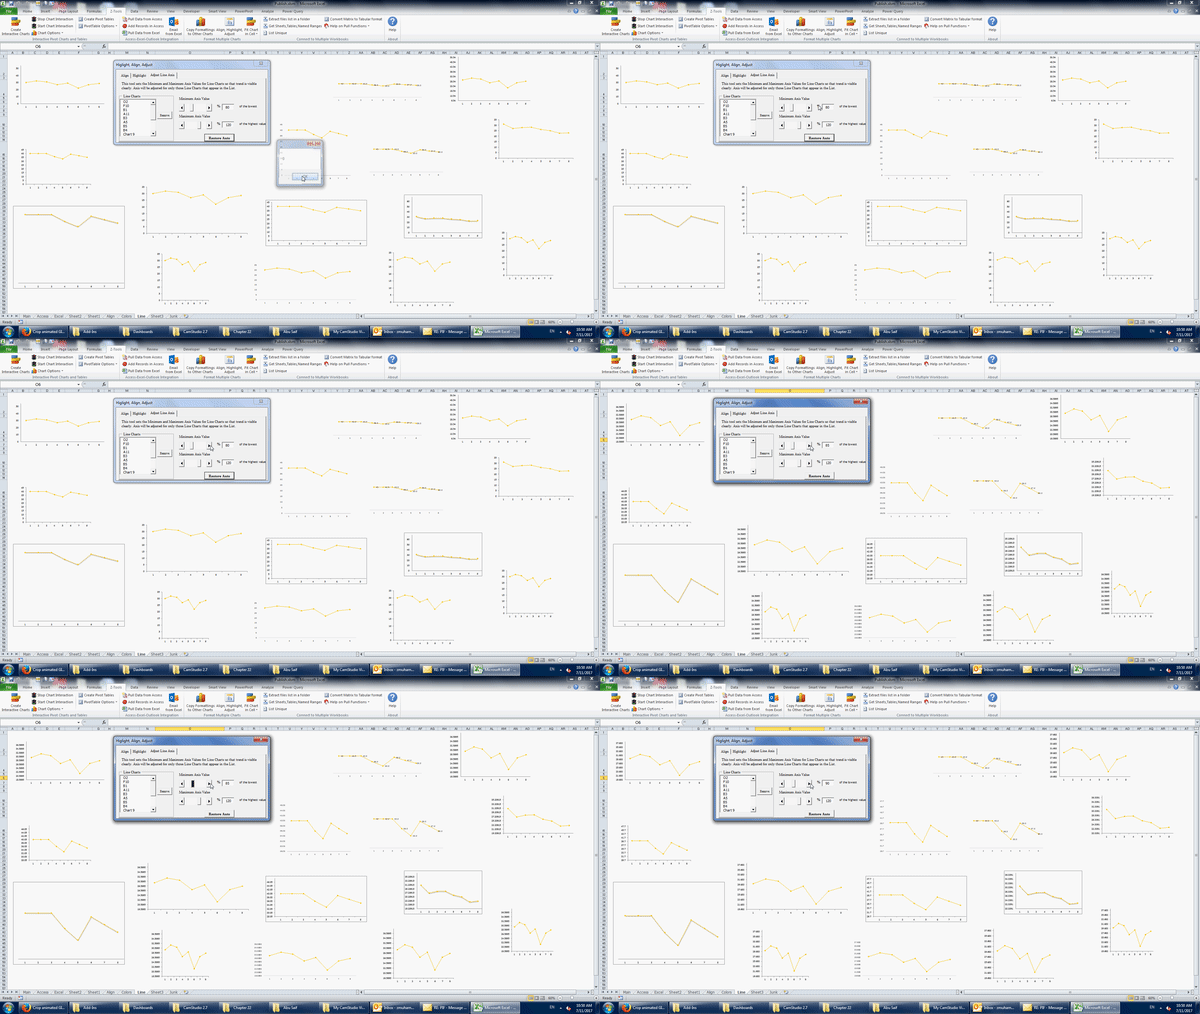
- Truncate Axis for Line charts to depict trend clearly
- Fit charts in cells
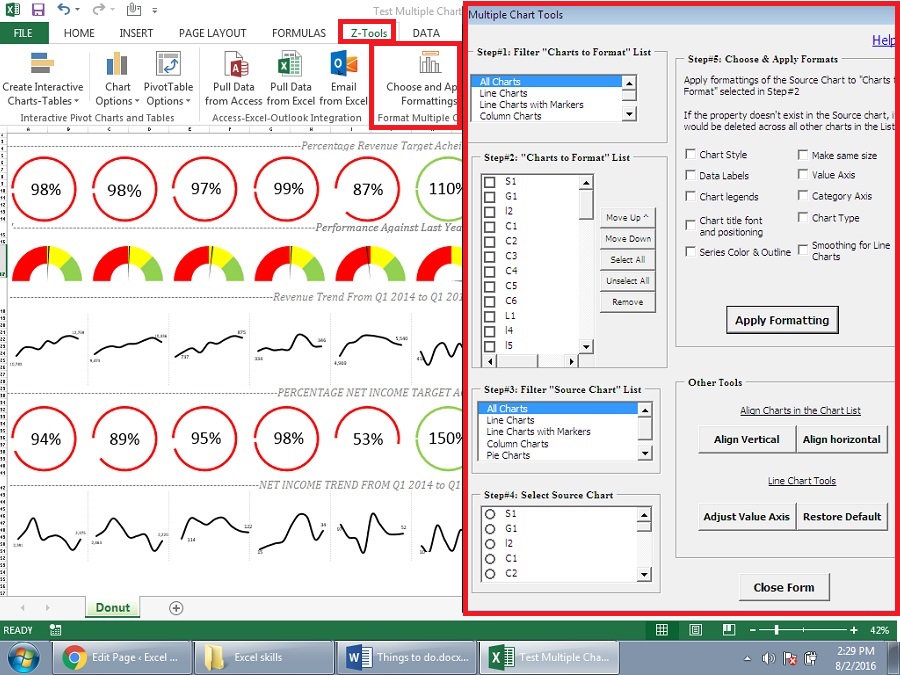
These tools are part of my Z-Addin (Excel Add-In)
Download Z-Addin
You can download Z-Addin from the link below. Please provide email address so that if there is any improvement in this Addin, I can share it with you 🙂
There is no need to download again if you have already downloaded “Z-Addin” from another webpage in this website
[email-download download_id=”527″ contact_form_id= “566”]
SOME EXAMPLES OF THINGS YOU CAN DO WITH THIS UTILITY
Copy Chart formattings to Other Charts
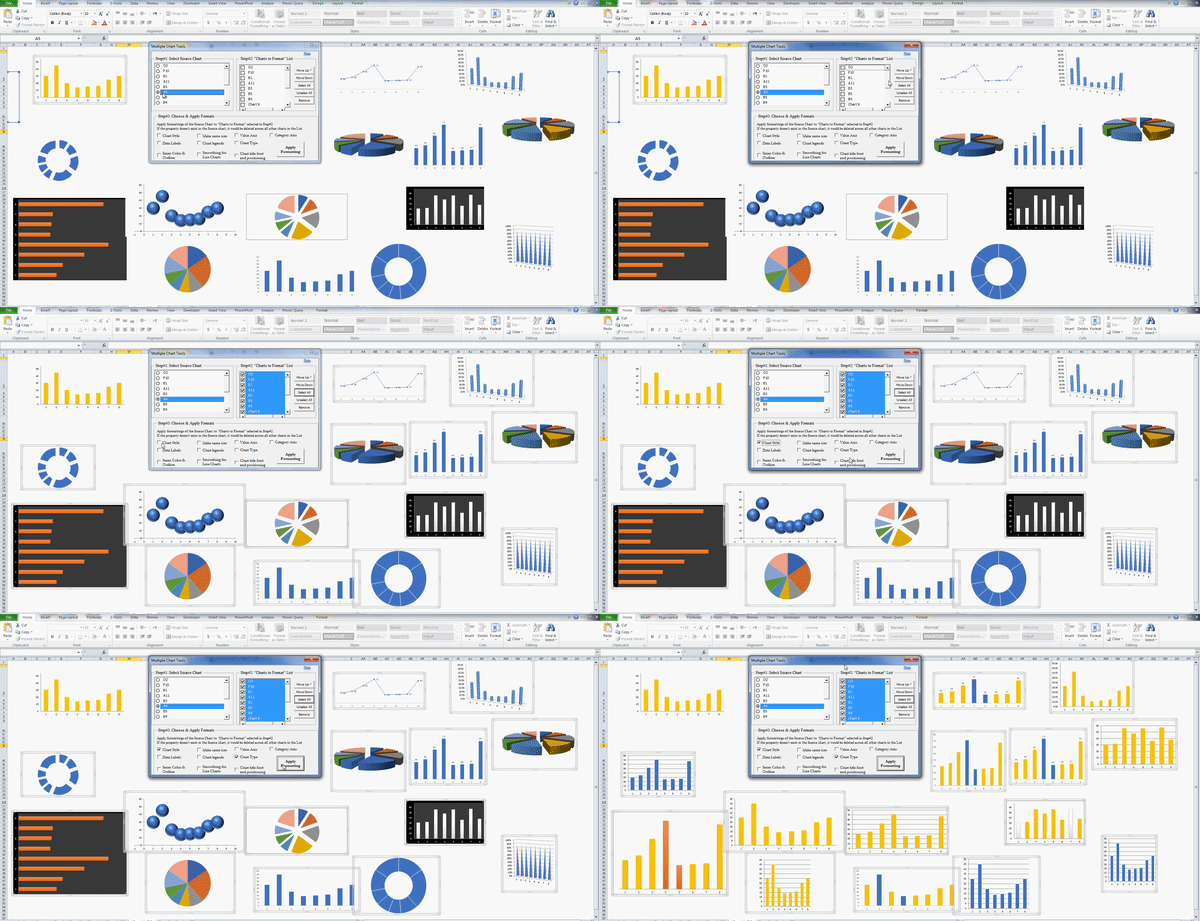
Make Same Size & Align
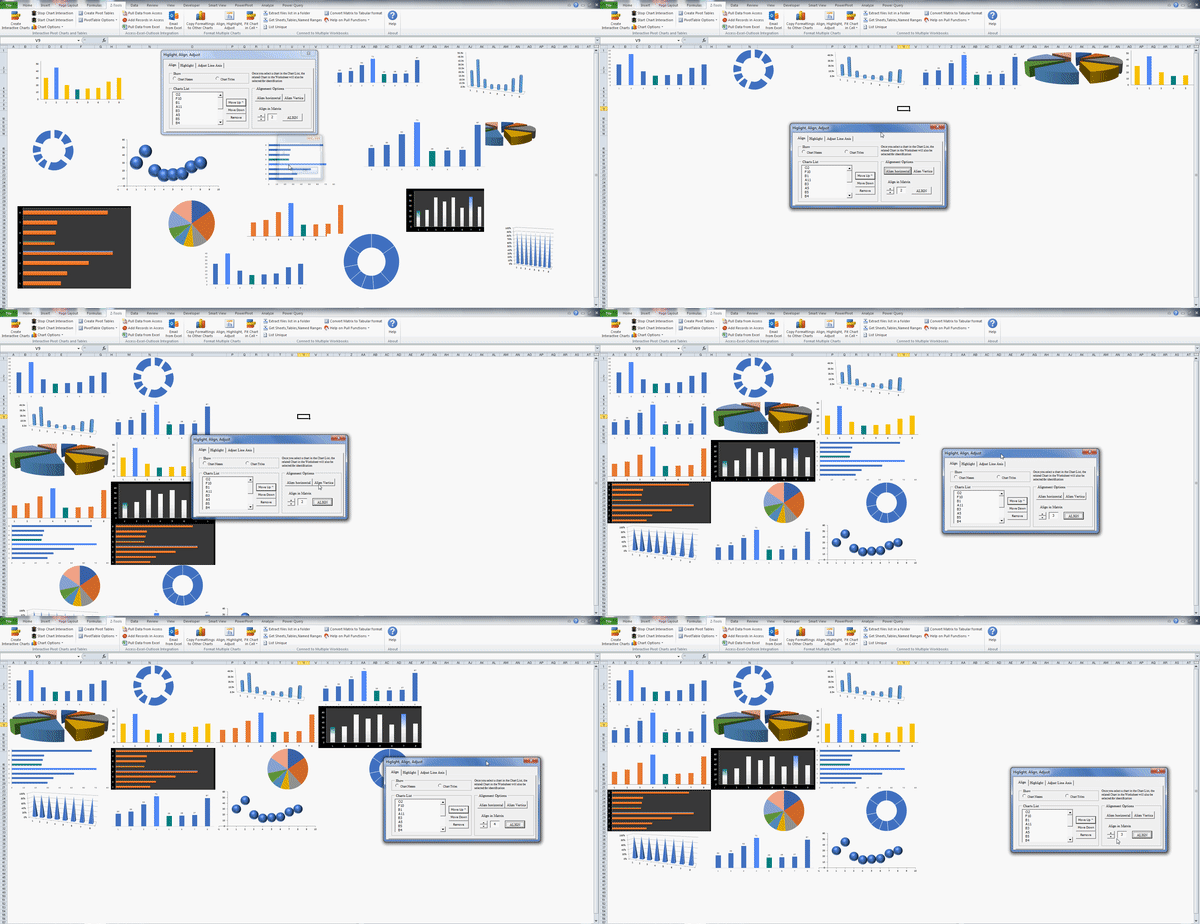
Highlight Low, High and other points
Truncate Axis for Line Charts simultaneously
Fit Charts in Cell
Excel already has Sparklines, the in-cell charts for data visualization but they are limited in
- Only 3 types of sparklines are available (Line, Column, WinLoss)
- Only one Chart Series(Sparkline series) is allowed
Take a look at animated image. This tool will fit your Excel charts in Cells you want. So you will get the both of both worlds (Charts and Sparklines)

You must try this tool to get a feel of what it does.
Please make a back up of your file before you do
Download
You can download the copy of this Addin from the link below. Please provide email address so that if there is any improvement in this Addin, I can share it with you 🙂
There is no need to download again if you have already downloaded “Z-Addin” from another webpage in this website
[email-download download_id=”527″ contact_form_id= “566”]

