WHY WOULD YOU
and
HOW COULD YOU
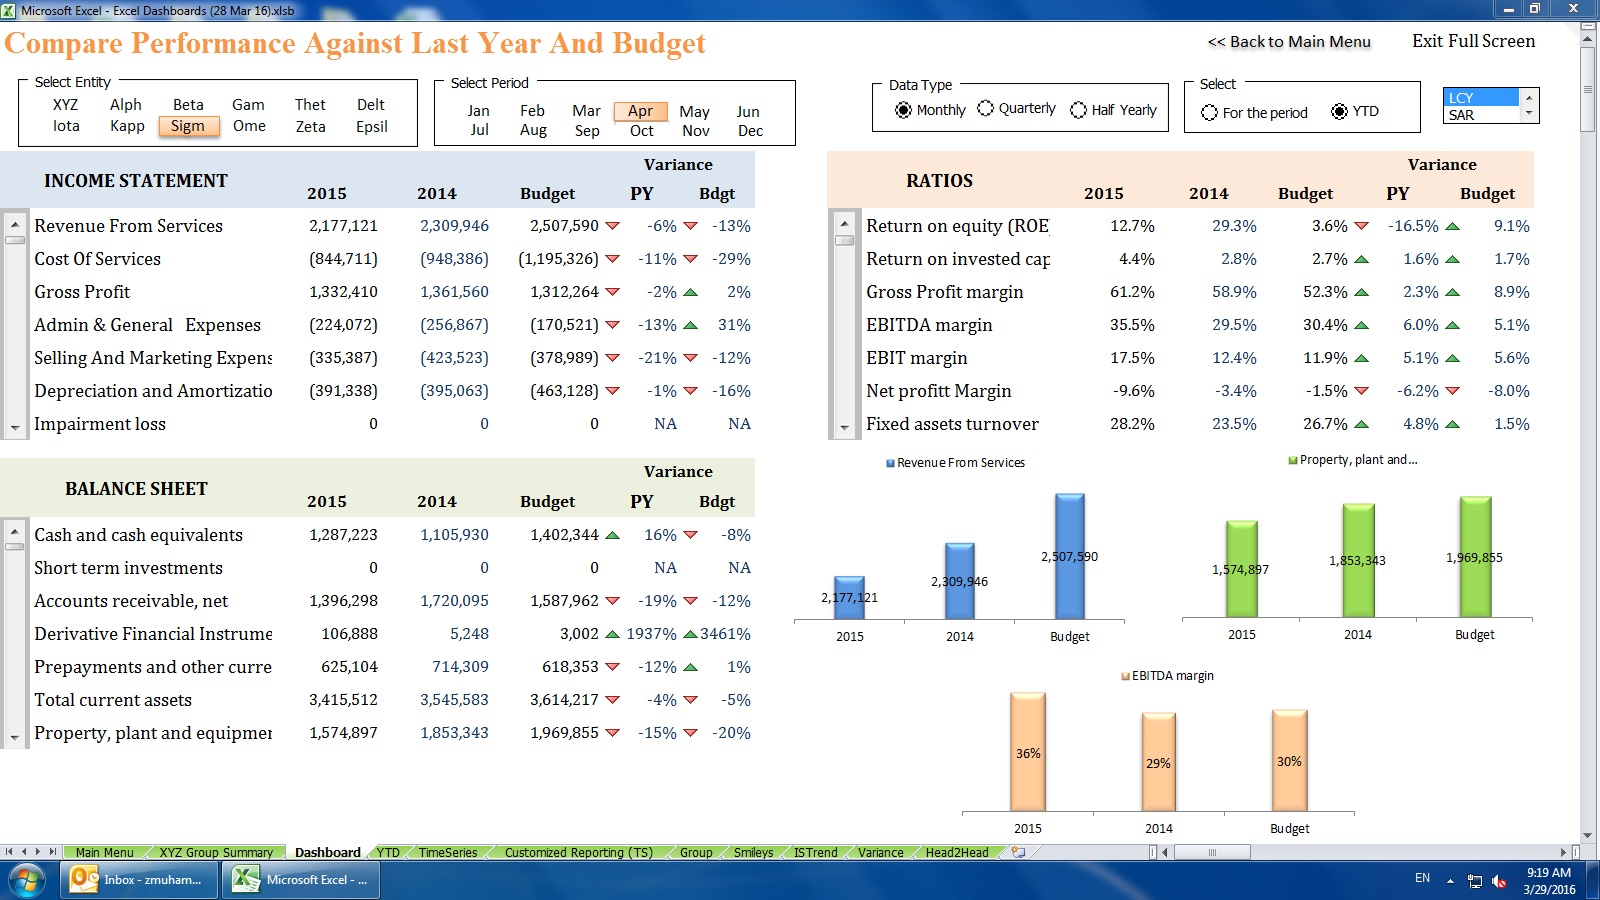
SQUEEZE 3 DIFFERENT FINANCIAL STATEMENTS IN A SINGLE SCREEN?
Imagine yourself in a Board Meeting being presented with Quarterly Performance Report of your Company. The presenter presents the income statement in a slide, then moves to another slide to relate the financial performance with financial position and changes in cash flows. He then moves back and forth between slides based on the questions posted by the Directors.
What’s wrong here?
Whenever presenter shifts from one screen to another or scrolls to show relationship between data, something very important is lost by the viewers— the big picture— the important connections that might not be visible otherwise.
With this in mind, I devised this interactive dashboard where in a single screen Management can view 3 critical (full length) statements at a time.
The statements themselves are interactive so that when user clicks any where in the table the related chart is updated to reflect that financial statement item
TOOLS AND TECHNIQUES USED
1) Form controls (check boxes and scroll bars mainly)
2) Worksheet event macros
3) Conditional formatting
4) Use of shapes with associated macros
[mc4wp_form id=”815″]