Pull and Analyse Data from Closed Excel Workbooks
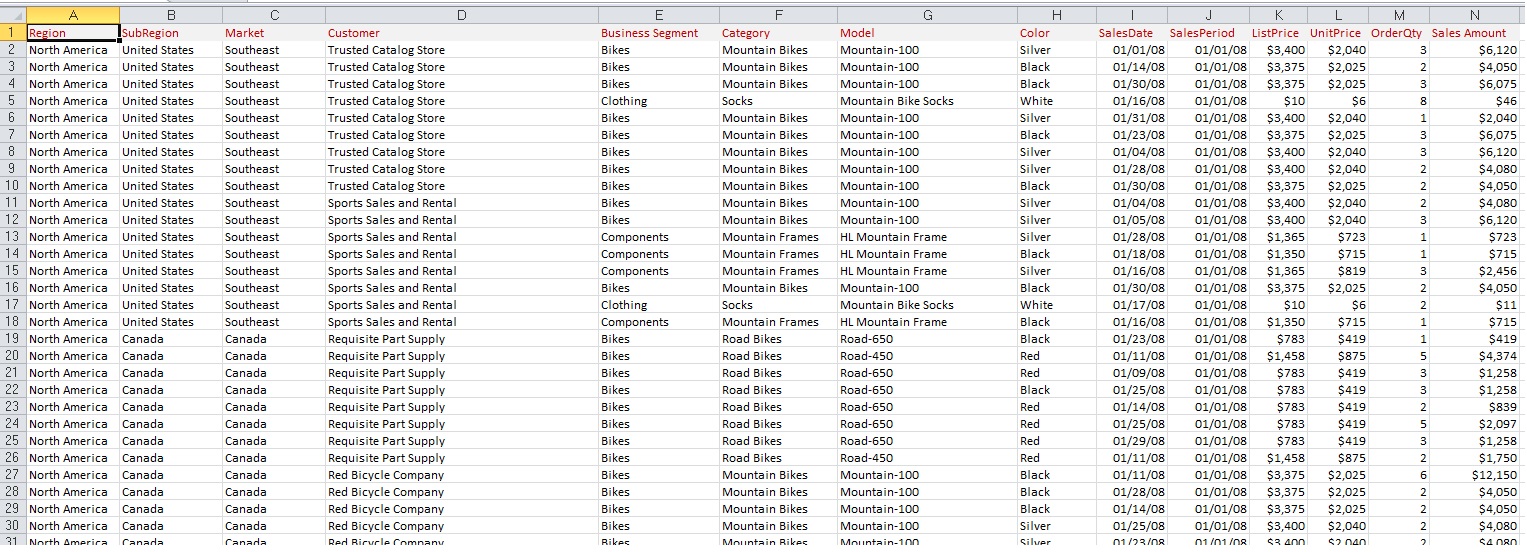
Although Excel is primarily a data analysis tool, it is still used as DATABASE by many. Primarily because EXCEL is much much easier to use than ACCESS. Moreover using some tricks and techniques you can incorporate strong Data Integrity features in Excel Workbooks which is the typical hallmark of ACCESS.
I thought an Excel Addin would be very handy which allows you to pull data from WORKSHEETS, EXCEL TABLES and NAMED RANGES in an Excel Workbook without opening it. Especially if you receive lot of data in a systematic tabular format which is periodically updated, you would love an Addin that quickly retrieves this data, process and transform it without requiring you to open that workbook.
This Addin allows you to
- Pull Data from Worksheets, Excel Tables and Named ranges
- Aggregate and Group Data
- Design and run Queries directly in excel
- Maintain history of your recent Workbooks for quick access later
Download
You can download the copy of this Addin from the link below
[download id=”527″]
STEP BY STEP INSTRUCTIONS TO USE “PULL FROM EXCEL” ADDIN
How to Install this Addin
Save the PullAddin.xlam file in your PC.
Note: Please don’t change the name of file, otherwise some features would not work
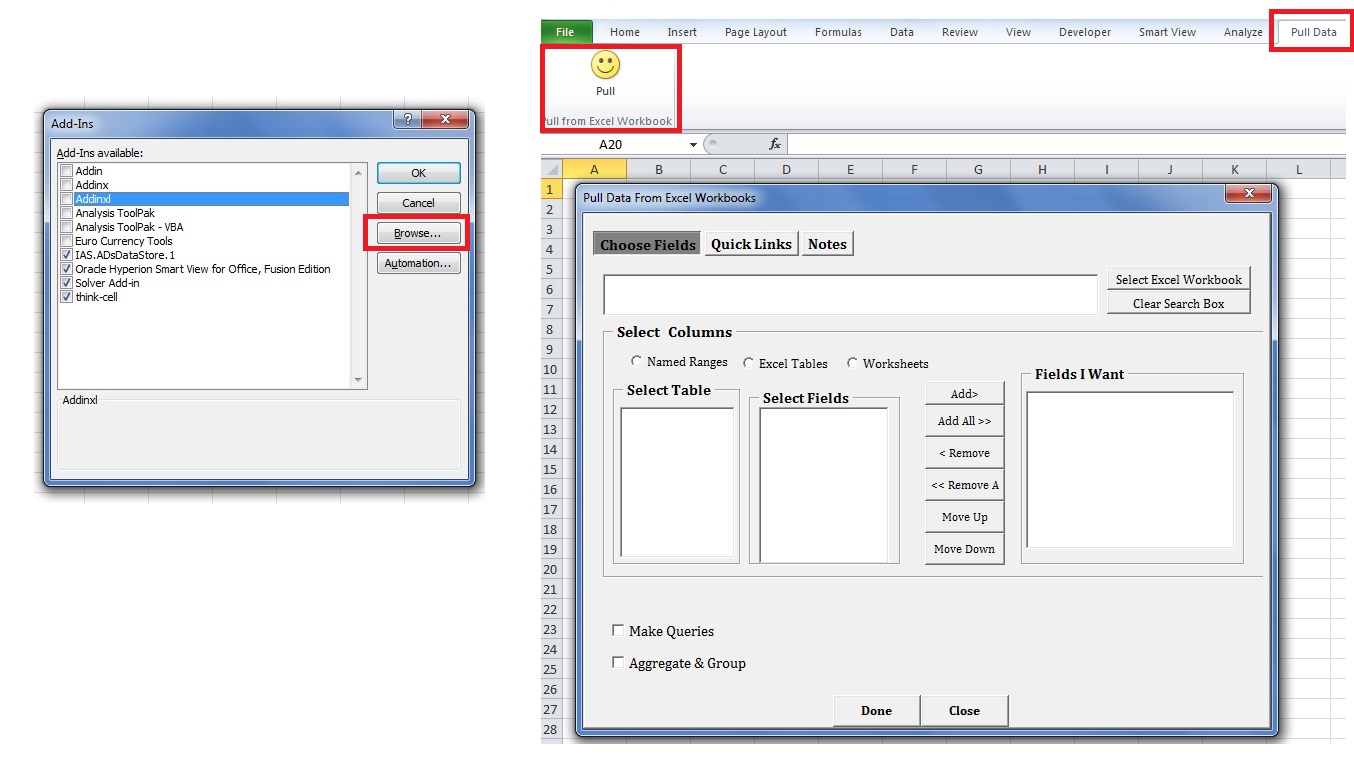
Open any excel workbook. Press ALT + T + I to open the Addin Manager. Browse for the file and enable the Addin
Once installed you will see a new tab “PULL” in your excel workbook. Activate the “PULL” Tab and press the “Smiley Face Button”
A dialog form would appear as shown below
Retrieving-Data-from-Excel Workbook
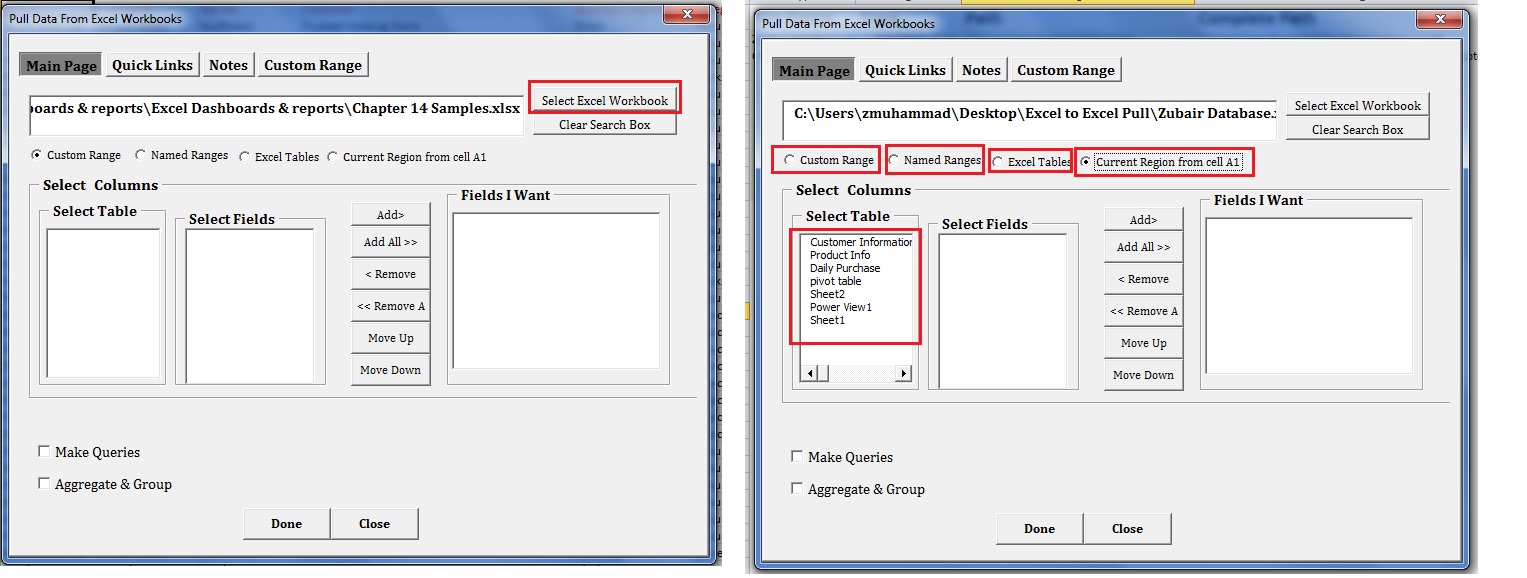
Press the “Select Excel Workbook” to browse and select your excel workbook to pull data from.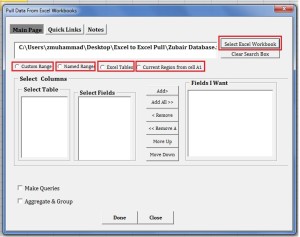
Select one of the four options
- Custom Range
- Named ranges
- Excel Tables
- Current Region from cell A1
as shown in figure.
CUSTOM RANGE: This option is different from the rest as it allows you to pull entire data of a worksheet or you can specify a range of data e.g. Cells A2:F65 in Sheet2. The demerit of this option is that you can not apply QUERIES and AGGREGATION and GROUPING with this option i.e. you can only pull raw data
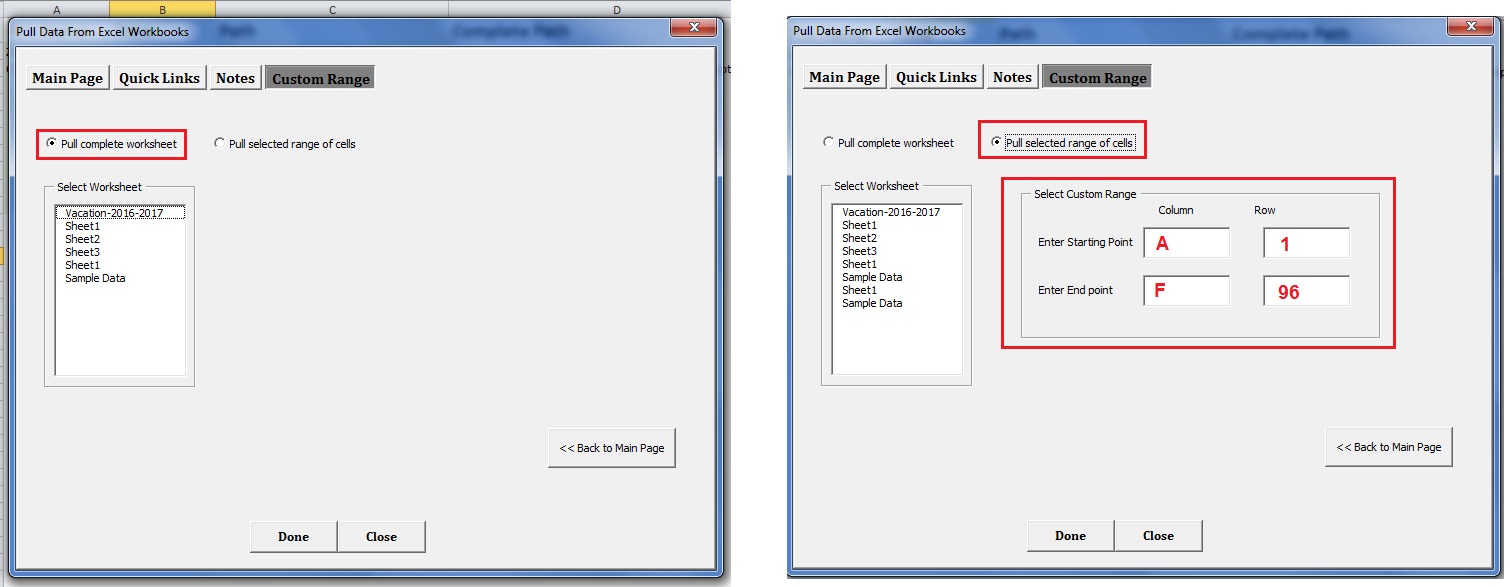
NAMED RANGES, EXCEL TABLES AND CURRENT REGION: In contrast to “Custom Range” option, these options allow you to select desired fields, apply queries, summarize and process data.
Current Region from Cell A1 means Data which is arranged in tabular format starting from cell A1 of the sheet with first row containing the table headings.
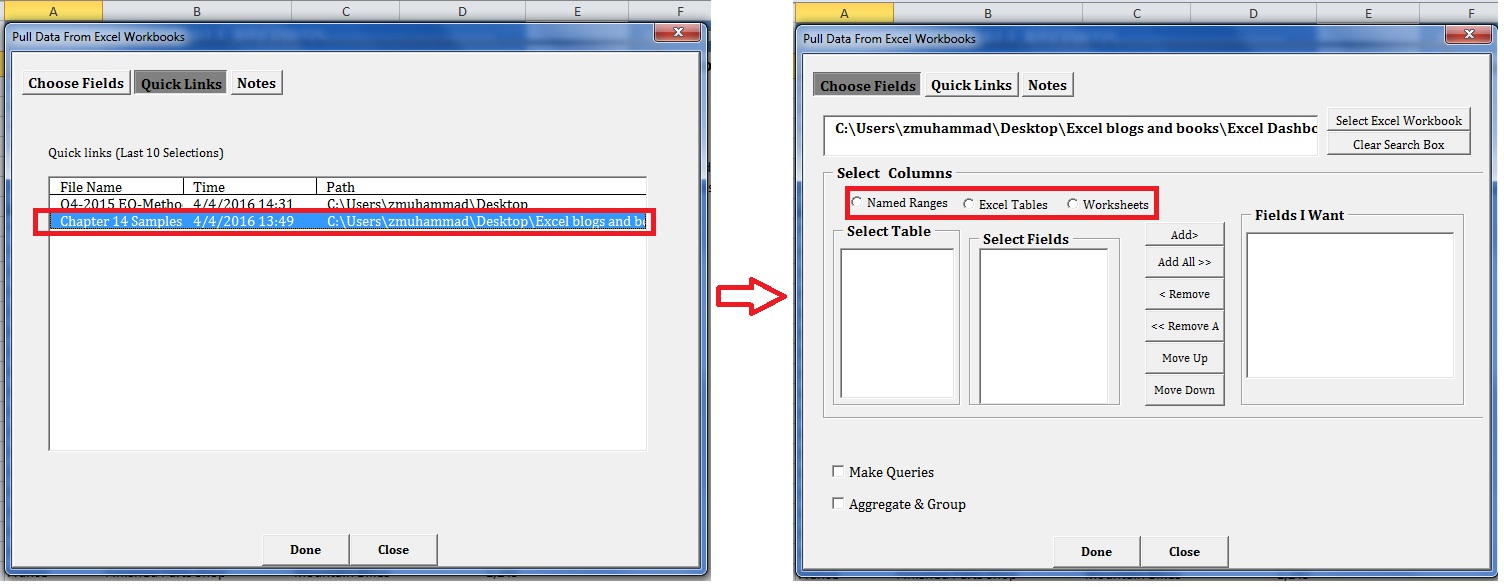
Once you click any of these options you would see list of all the named ranges, excel tables or worksheets in the “Select Table” frame. The file details would be stored in the quick links tab for quick access later
Select any table and you will see the next frame “Select Fields” gets populated with all the column in that named range/table/worksheet which you selected.
Select and Add your desired fields to the “Fields I want” frame. You can remove rearrange, remove or add fields using the command buttons beside the frame
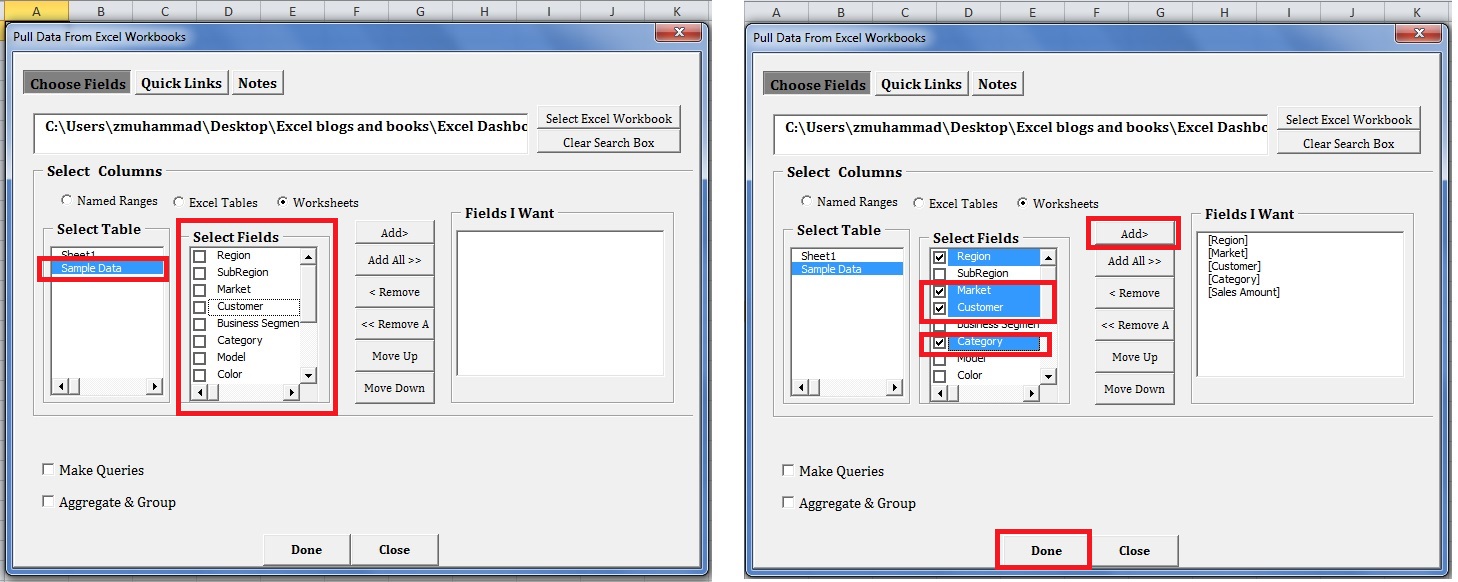
Click anywhere in the excel workbook where you want data to be placed and PRESS “DONE” button in the DIALOG FORM.
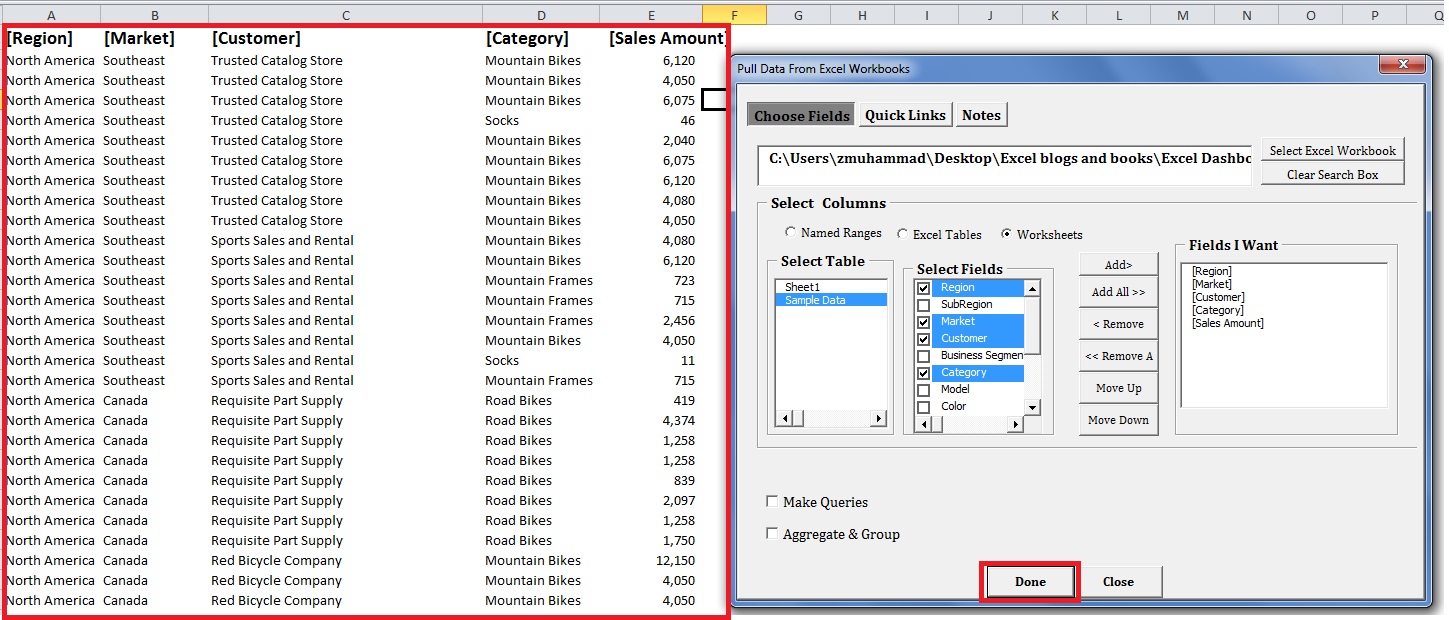
The Dialog Form works in MODELESS fashion i.e. you can work in EXCEL while the Dialog Box is open
The workbook details are added to the QUICK LINKS TAB so that you can quickly access it later
Aggregate and Group items
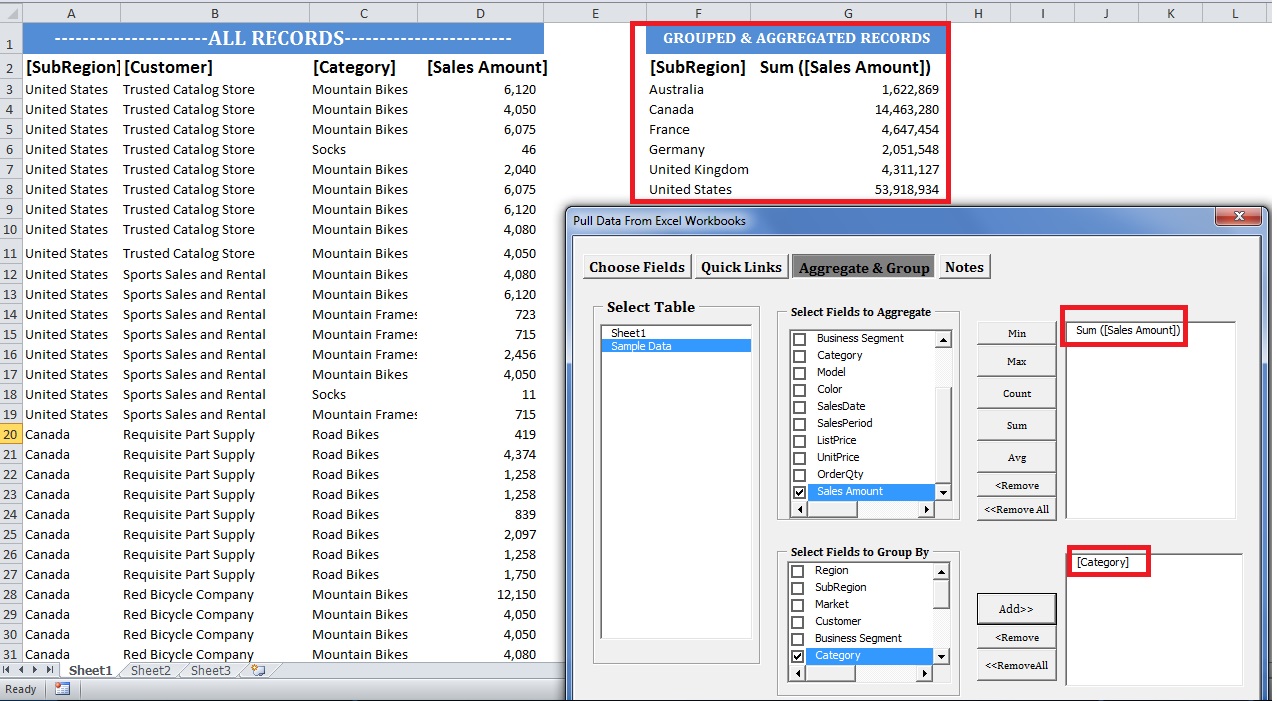
This powerful feature lets you summarize your data in tables and worksheets which might span thousands or even millions of rows.
Since databases are often collection of individual transactions, users/ analysts would be interested in summarizing data. For example in a daily sales table having ten thousand rows of individual sale transactions, you might like to see the total sales for a particular period for each customer and for each sales person.
Check the “Aggregate and Group” check box; you would be taken to new tab “Aggregate & Group”.
Select Table; you would see the list of fields in both “Choose fields to Aggregate” and “Choose Field to Group by” frames.
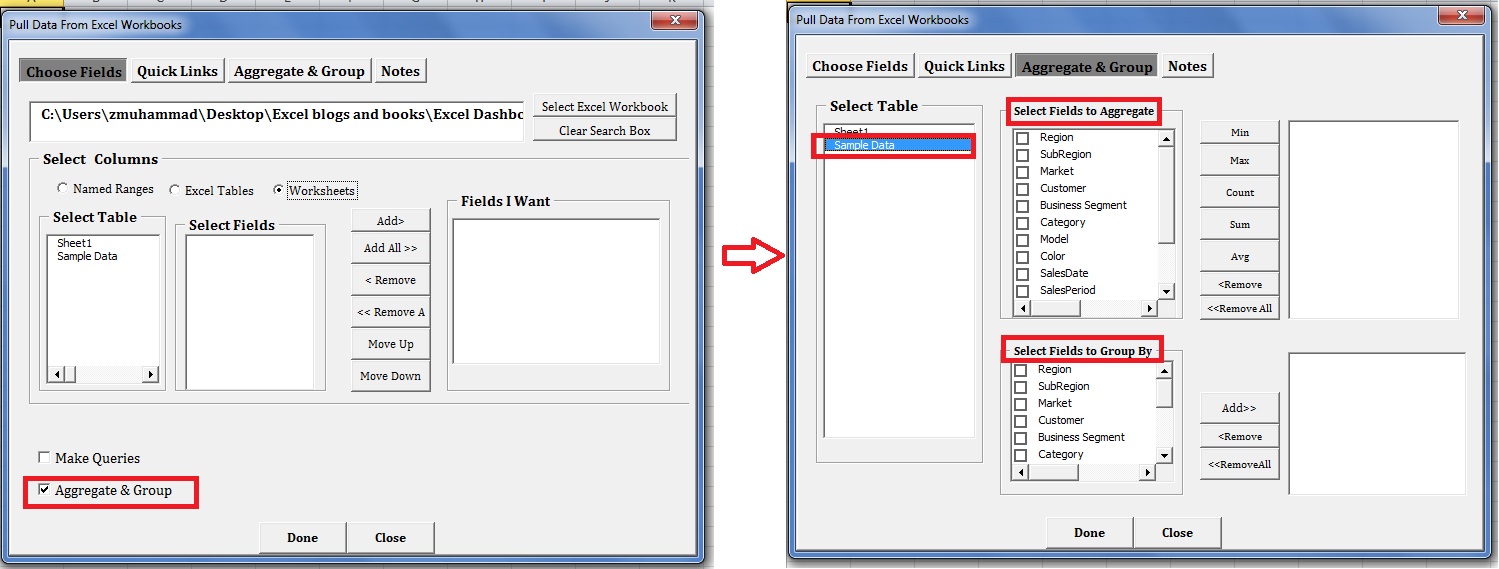
Only choose those fields to aggregate which contain numeric values, select the aggregation function (sum, count, average etc.) you wish to apply.
Only choose those fields to Group by which contain non-numeric values
Select any cell in your workbook and Press Done ; you will see the summarized data reflecting your selections above
You can make queries while using the Aggregation and Grouping tool. For example in the case above you might want to see the results only for a particular salesperson or customer. Queries are covered in detail below.
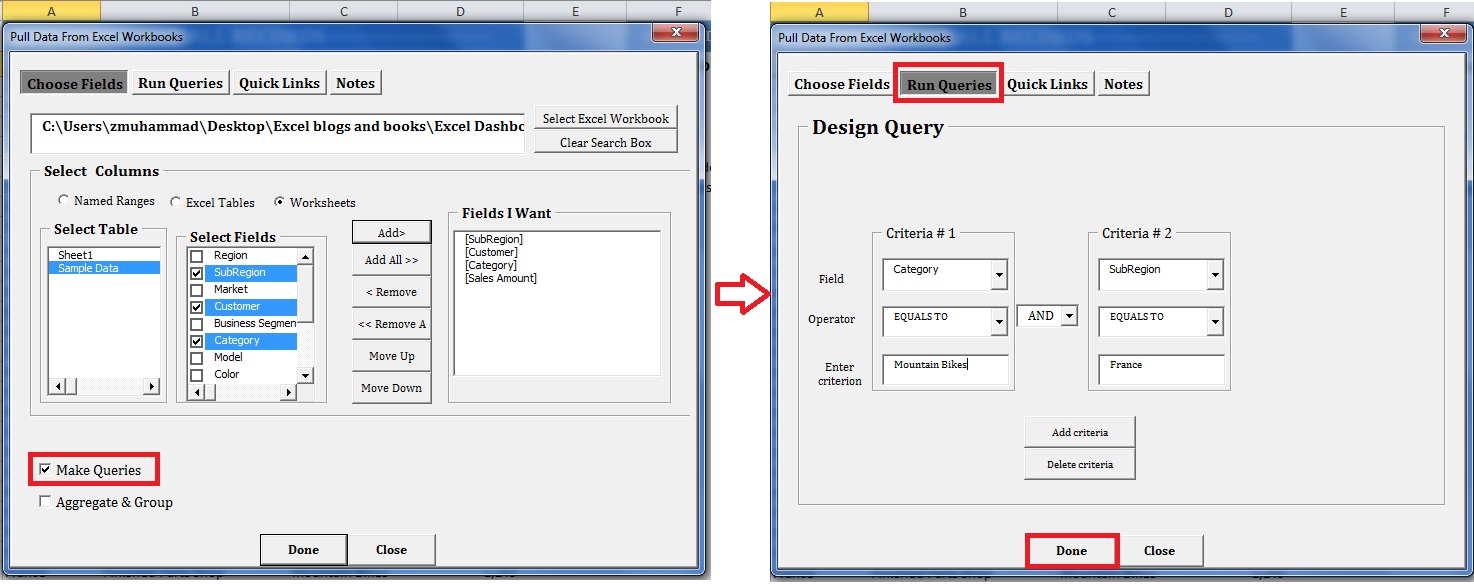
Make Queries
Queries work like Excel data filters. They allow you to get the particular records you need
To make queries check the “Make Queries” checkbox in choose fields box
HISTORY OF WORKBOOKS ACCESSED
The Addin maintains history of 10 most recent Workbooks which you have accessed using this Addin.
This helps you quickly access your most used Workbooks without having to browse and locate them again.
Go to the Quick Links tab. Just Double click on the Workbook you want to retrieve data from