Pull and analyse data from Closed Access Databases & Closed Excel Workbooks
You are going to love this Excel Addin — if you regularly Pull Data (especially Data in Tabular format) into excel.
I created this Addin with the objective of providing quick and convenient access to often used Data Sources. This Addin uses ADO (ActiveX Data Objects) to establish connection and SQL queries for analyzing data.
An interactive VBA userform allows you to select, combine and pull the desired data.
Download
You can download the copy of this Addin from the link below
[download id=”527″]
5 Powerful Features of PullAddin
- Choose and Pull Data from the Specific Fields You Need
- Aggregate and Group Data like a pivot table in many interesting ways
- Design and run Queries
- Create relationships between tables.
- Maintain history of your recent Access Databases for quick access later
STEP BY STEP INSTRUCTIONS TO USE “PULL FROM ACCESS” ADDIN
How to Install this Addin
Save the PullAddin.xlam file in your PC.
Note: Please don’t change the name of file, otherwise some features would not work
Open any excel workbook. Press ALT + T + I to open the Addin Manager. Browse for the file and enable the Addin
Once installed you will see a new tab “PULL” in your excel workbook. Activate the “Access” Tab and press the “Smiley Face Button”
A dialog form would appear as shown below

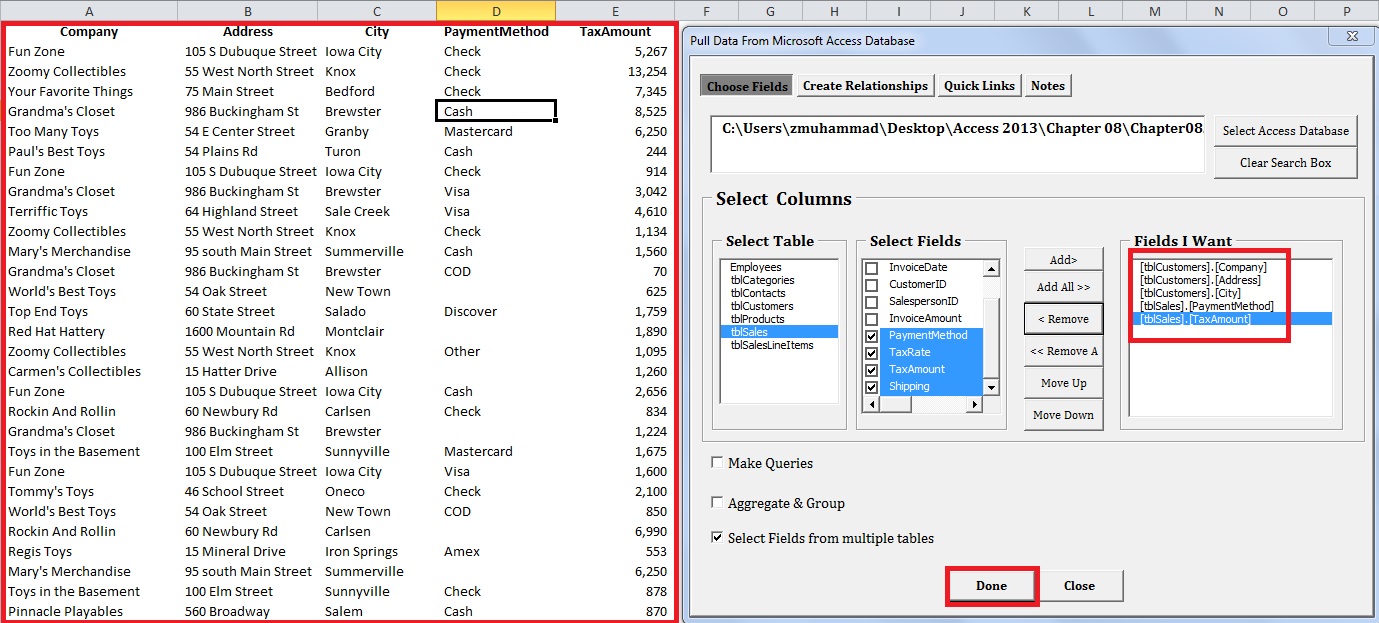
Retrieving Data from Specific Access Fields
Press the “Select Access Database” to browse and select your access database.
The database won’t open, however you would see the list of all the tables in the “Select Table” frame. The file details would be stored in the quick links tab for quick access later
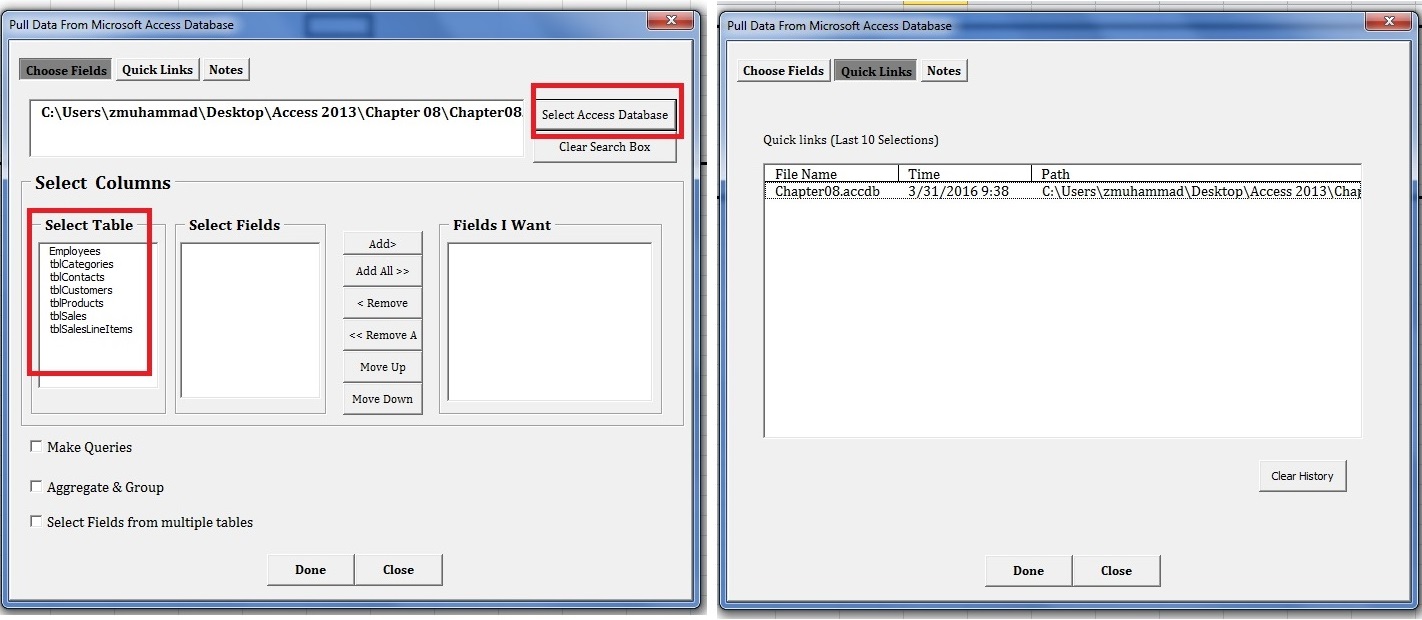
Select any table and you will see the next frame “Select Fields” gets populated with all the fields in that table
Select and Add your desired fields to the “Fields I want” frame. You can remove rearrange, remove or add fields using the command buttons beside the frame
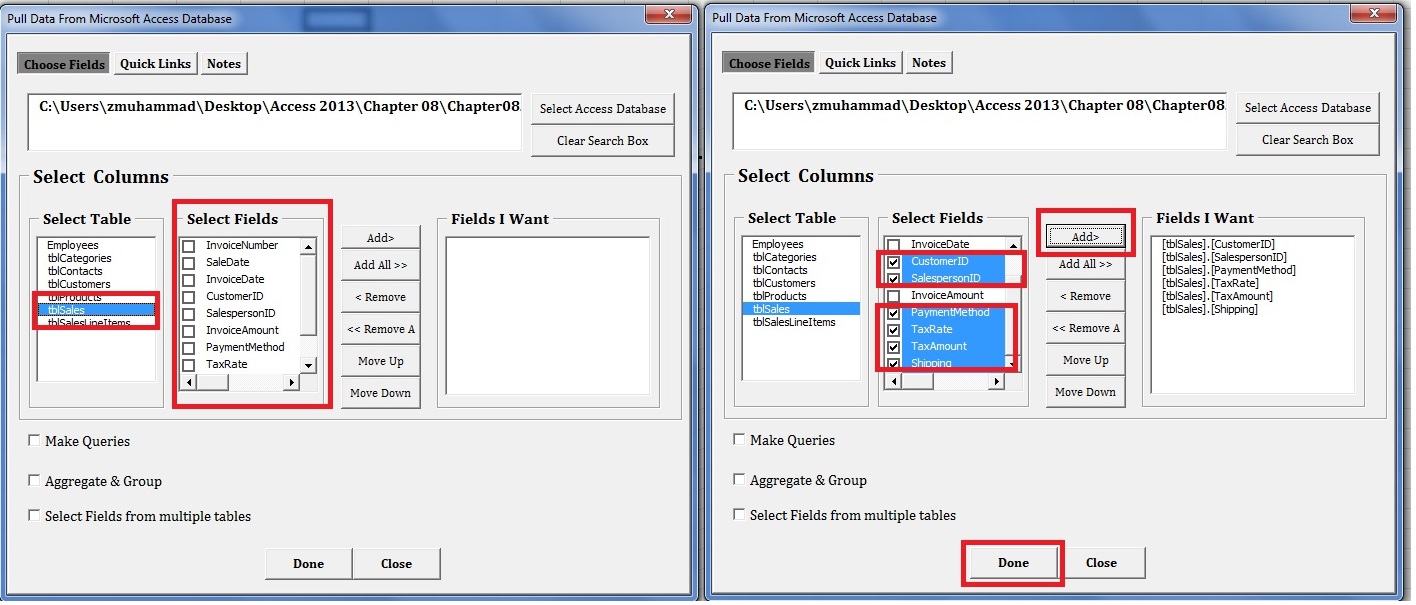
Click anywhere in the excel workbook where you want data to be placed and PRESS “DONE” button in the DIALOG FORM.
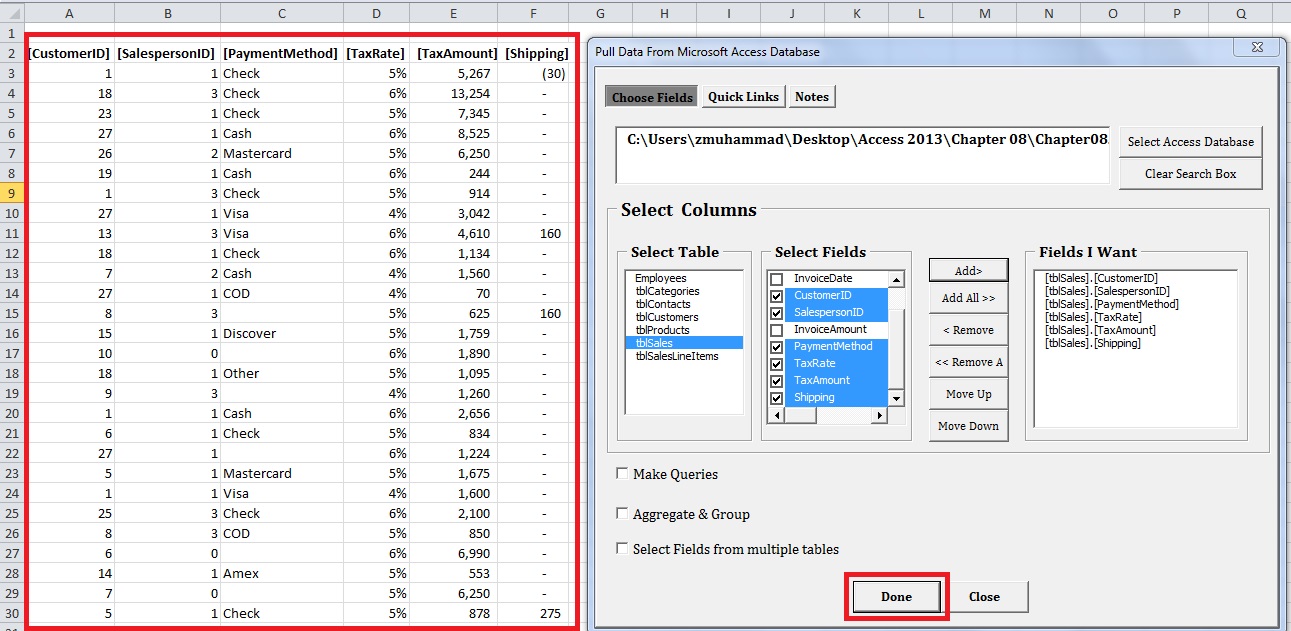
The Dialog Form works in MODELESS fashion i.e. you can work in EXCEL while the Dialog Box is open
The database file details is added to the QUICK LINKS TAB so that you can quickly access it later
Aggregate and Group items/ Perform Cross Tab Queries
This powerful feature lets you summarize your data in ACCESS tables which might span thousands or even millions of rows.
Since ACCESS tables are often collection of individual transactions, users/ analysts would be interested in summarizing data. For example in a daily sales table having ten thousand rows of individual sale transactions, you might like to see the total sales for a particular period for each customer and for each sales person.
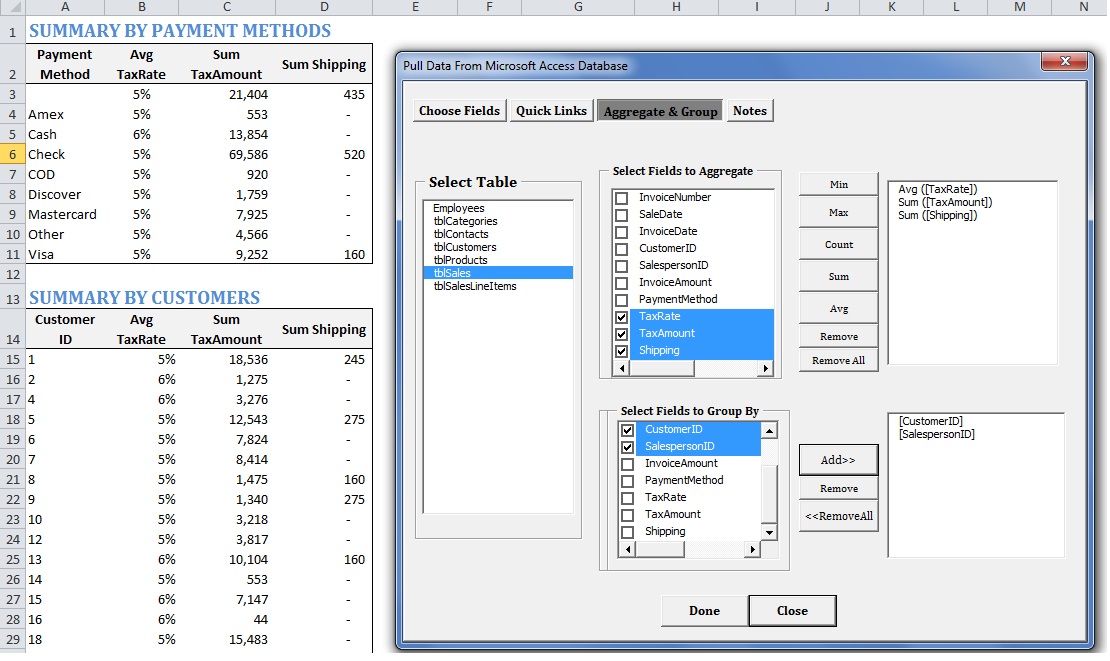
Check the “Aggregate and Group” check box as shown below; you would be directed to a new tab “Aggregate & Group”.
Select any table. You would see the list of fields in both “Choose fields to Aggregate” and “Choose Field to Group by” frames.
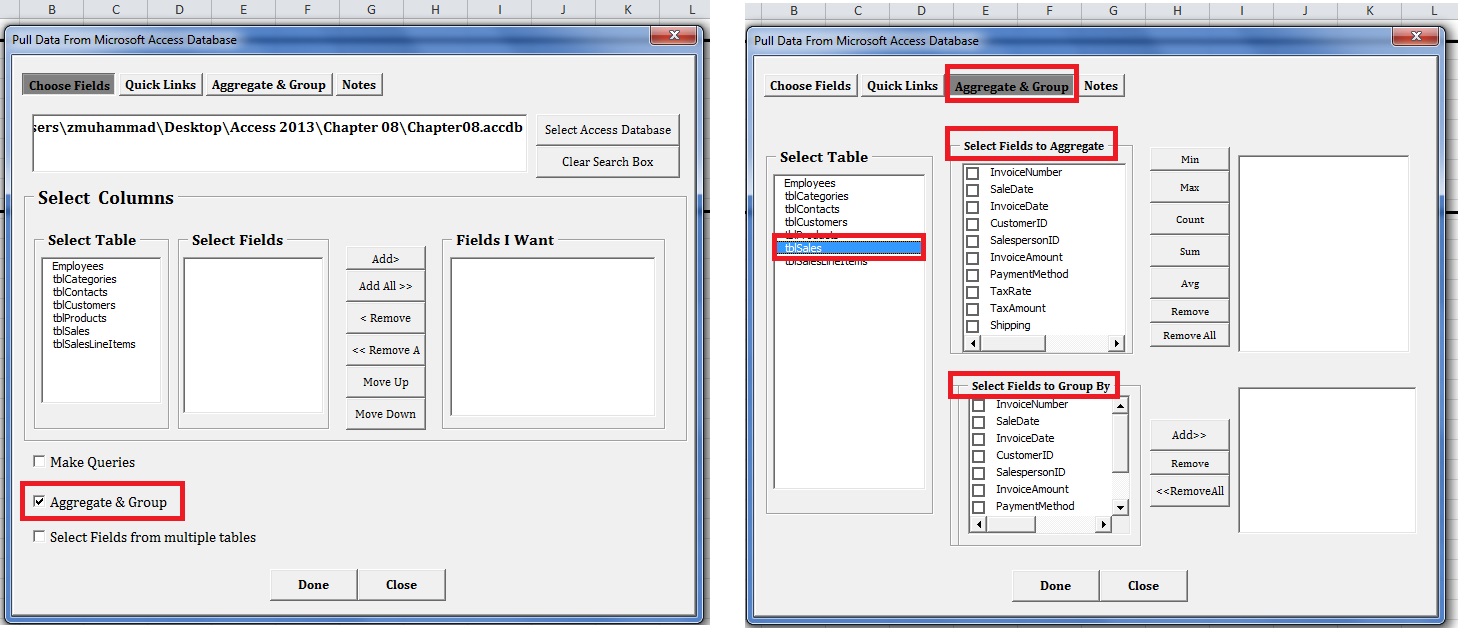
Only choose those fields to aggregate which contain numeric values, select the aggregation function (sum, count, average etc.) you wish to apply.
Only choose those fields to Group by which contain non-numeric values
Select any cell in your workbook and Press Done ; you will see the summarized data reflecting your selections above
You can make normal queries while using the Aggregation and Grouping tool. For example in the case above you might want to see the results only for a particular salesperson or customer. Queries are covered in detail below.
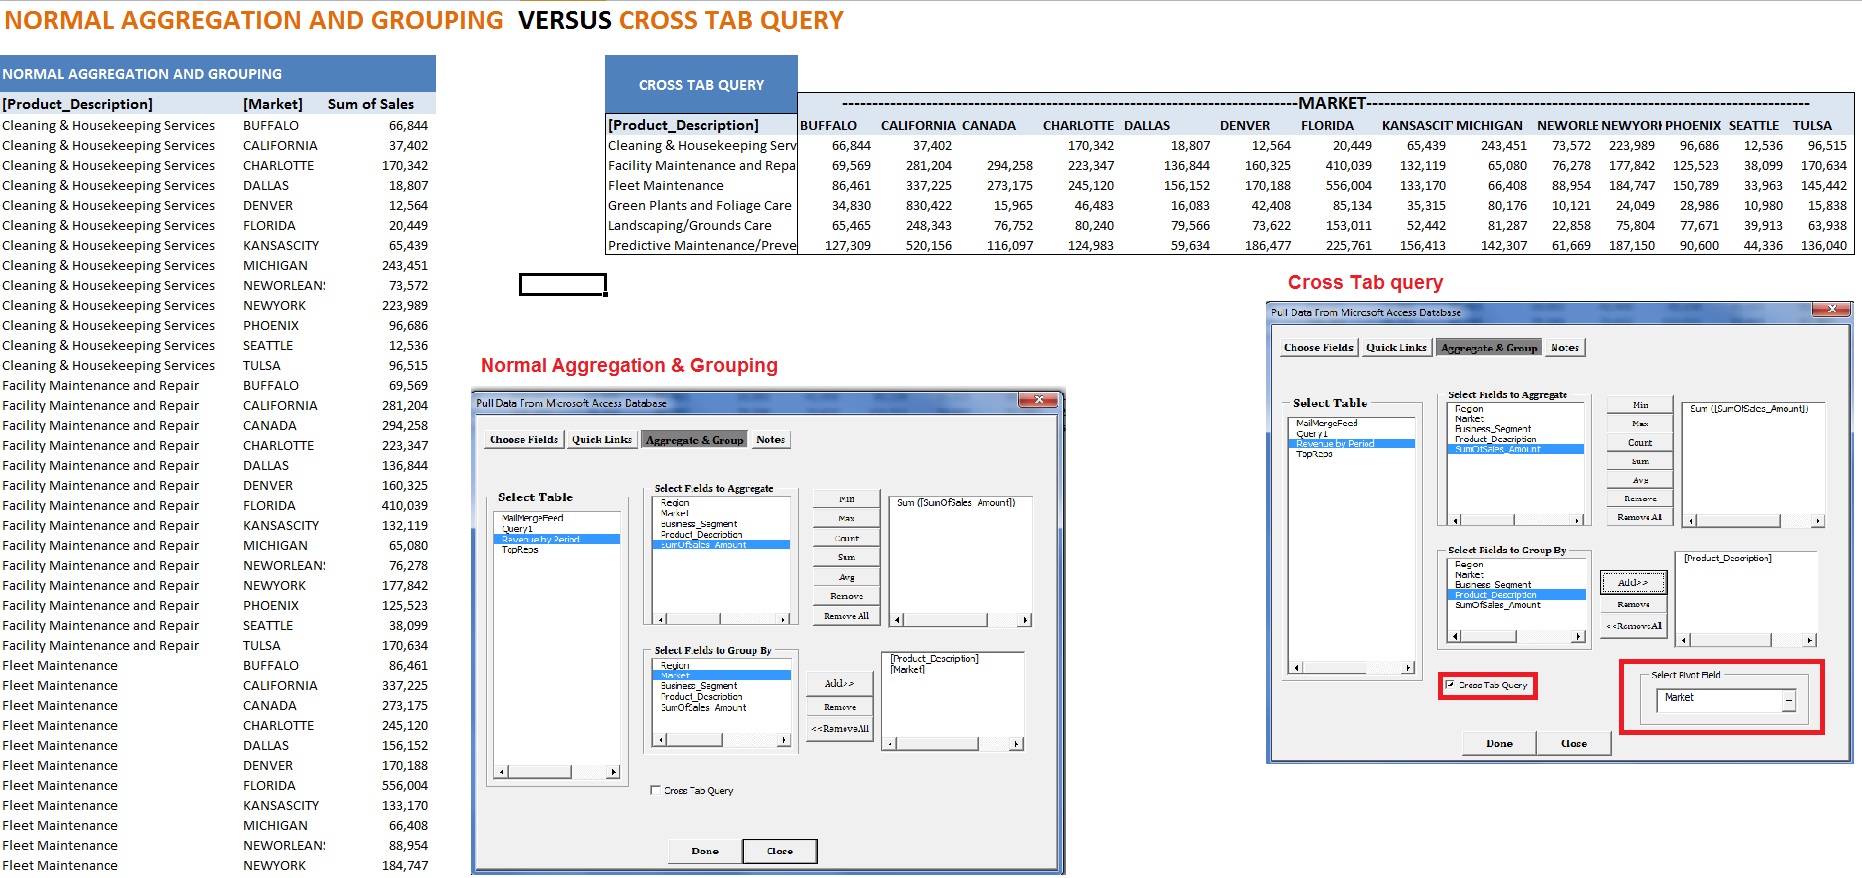
A Cross Tab Query allows you to view an aggregated field across two sets of values— one down the side of the datasheet and the other across the top. This results in data in a compact Matrix Format which can be very valuable for analysis. The demerit is that you can only view one aggregated field.
The figure below illustrates the difference between output from normal Aggregation & Grouping and output from Cross Tab Query
To perform a cross tab query,
- Go to Aggregate & Group Tab, tick/check the “cross tab query” checkbox as shown above
- You will see a new frame “Select Pivot Field”. Choose a field from the drop down. This field will form columns of the Output/Result of Cross Tab Query
- Choose a numeric field to aggregate in the “Select Fields to Aggregate” box and press the desired aggregation function
- Choose a field in “Select Fields to Group by” box and press the “Add” button. This field would form the rows of the Output/Result of Cross Tab Query
- Select a cell in your excel workbook and press “DONE”
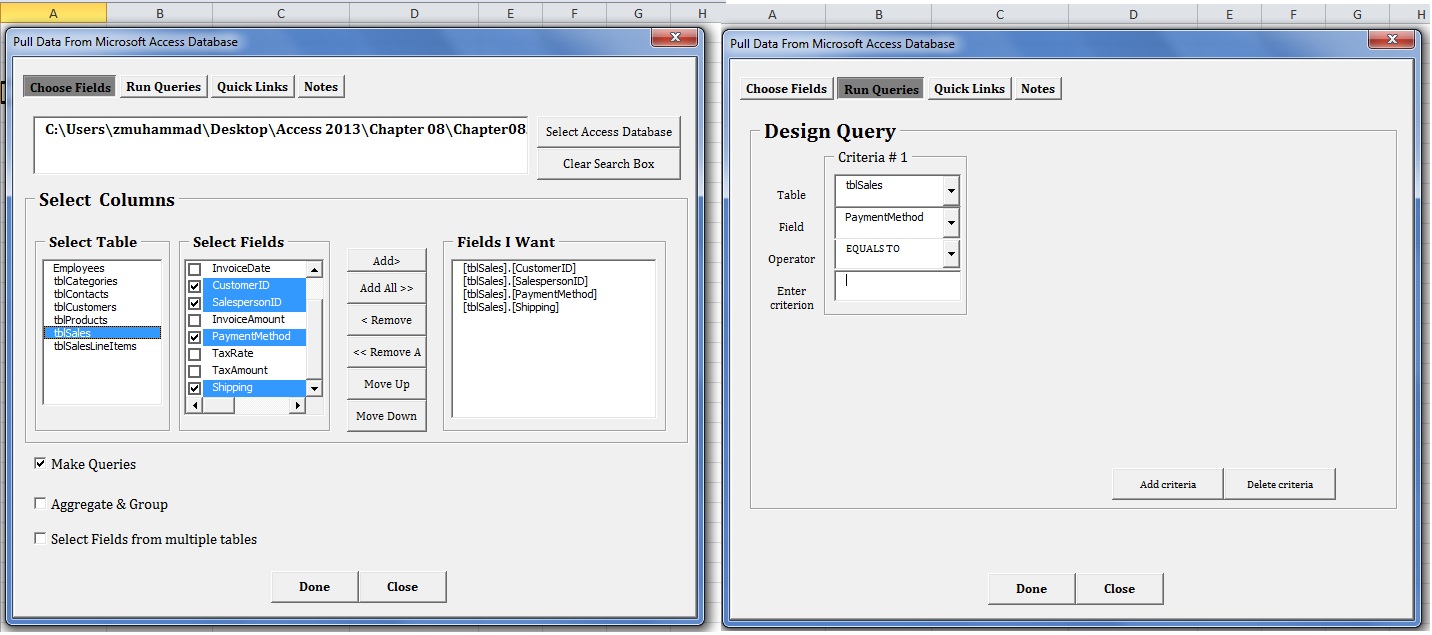
Make Queries
Queries work like Excel data filters. They allow you to get the particular records you need
To make queries check the “Make Queries” checkbox in choose fields box
Create Relationships and get data between related tables
To select fields from multiple related tables, click the “Select Fields from multiple tables” checkbox as shown below.
A new tab “Create Relationships” would become active now. Select related tables and fields and press the “Create Relationship” button
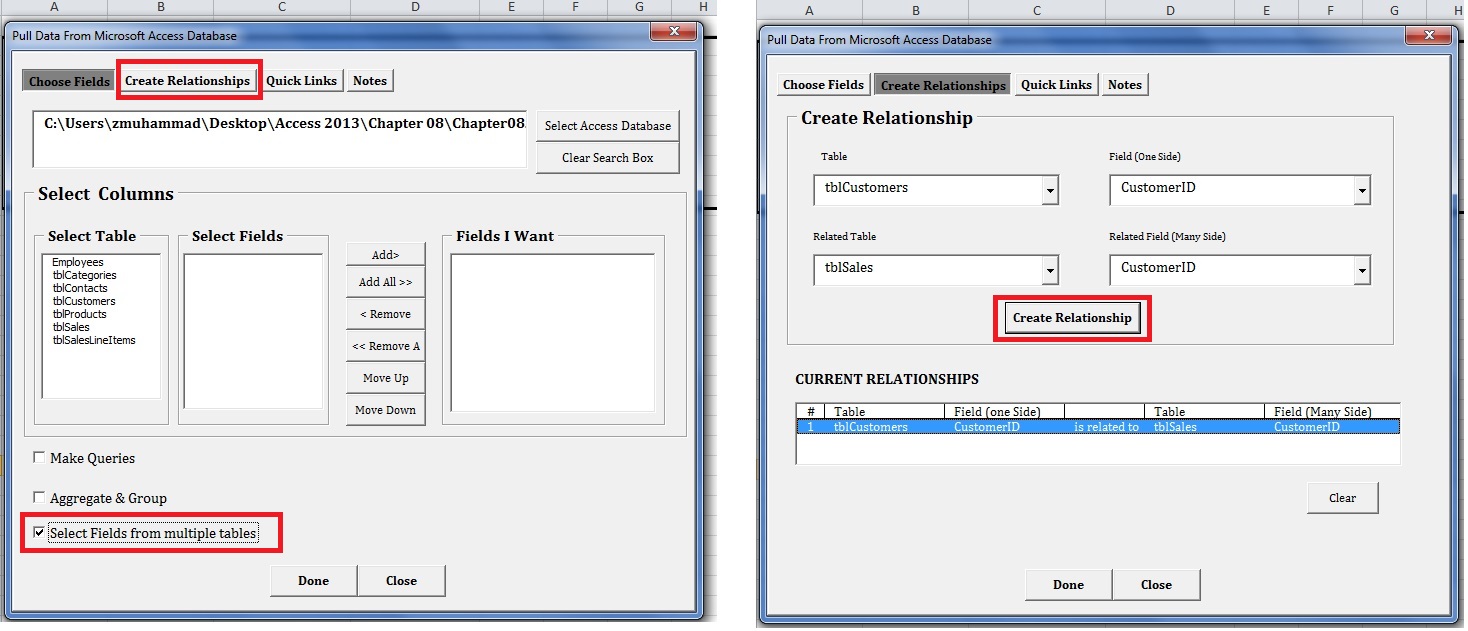
Return back to “Choose Fields” tab and you will notice that now you can select fields from multiple tables.
Select the cell where you want data to be placed. Press done and check the results
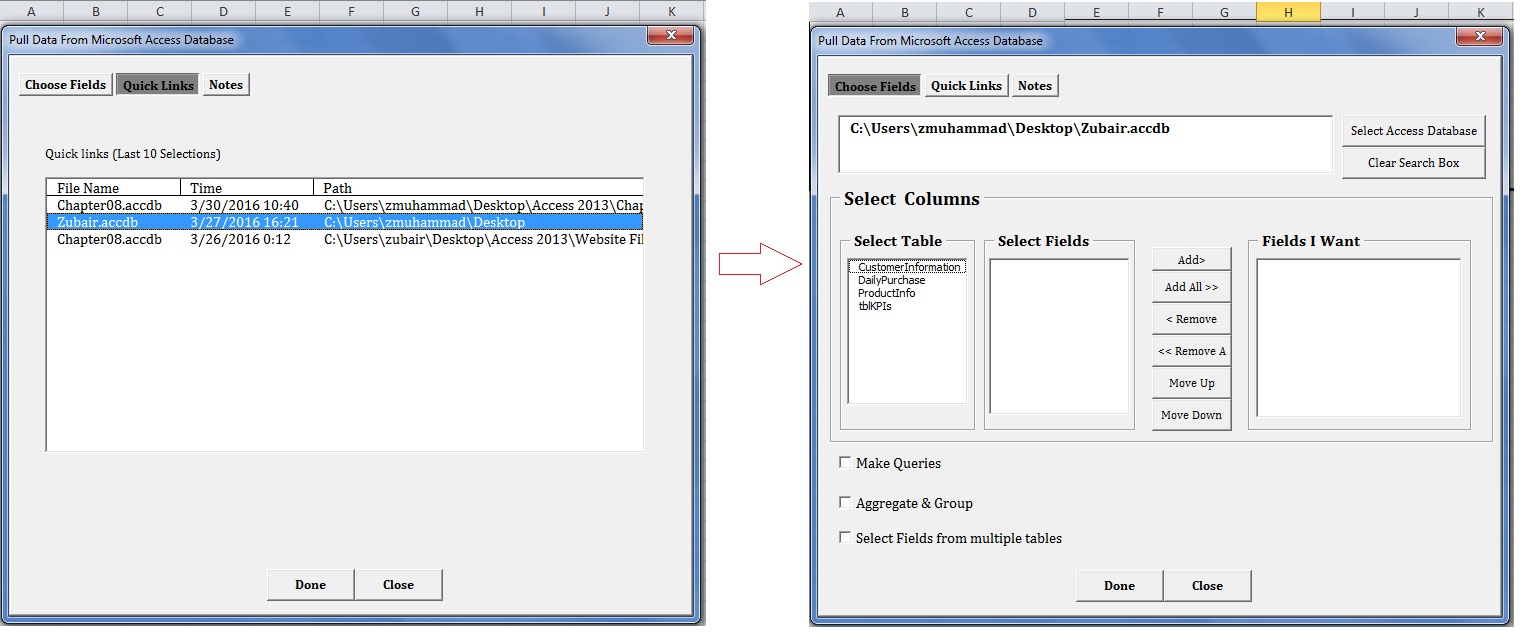
HISTORY OF MICROSOFT ACCESS DATABASES OPENED
The Addin maintains history of 10 most recent Access Databases which you have accessed using this Addin.
This helps you quickly access your most used Databases without having to browse and locate them again.
Go to the Quick Links tab. Just Double click on the Database you want to retrieve data from
[huge_it_share]