VALUES FUNCTION and PARAMETER(UNRELATED) TABLES
One of the beauties of DAX is that a data modeler can set up her own Tables (Unrelated or Parameter Tables) to enrich or enhance their Data Model/ Dashboards and Reports.
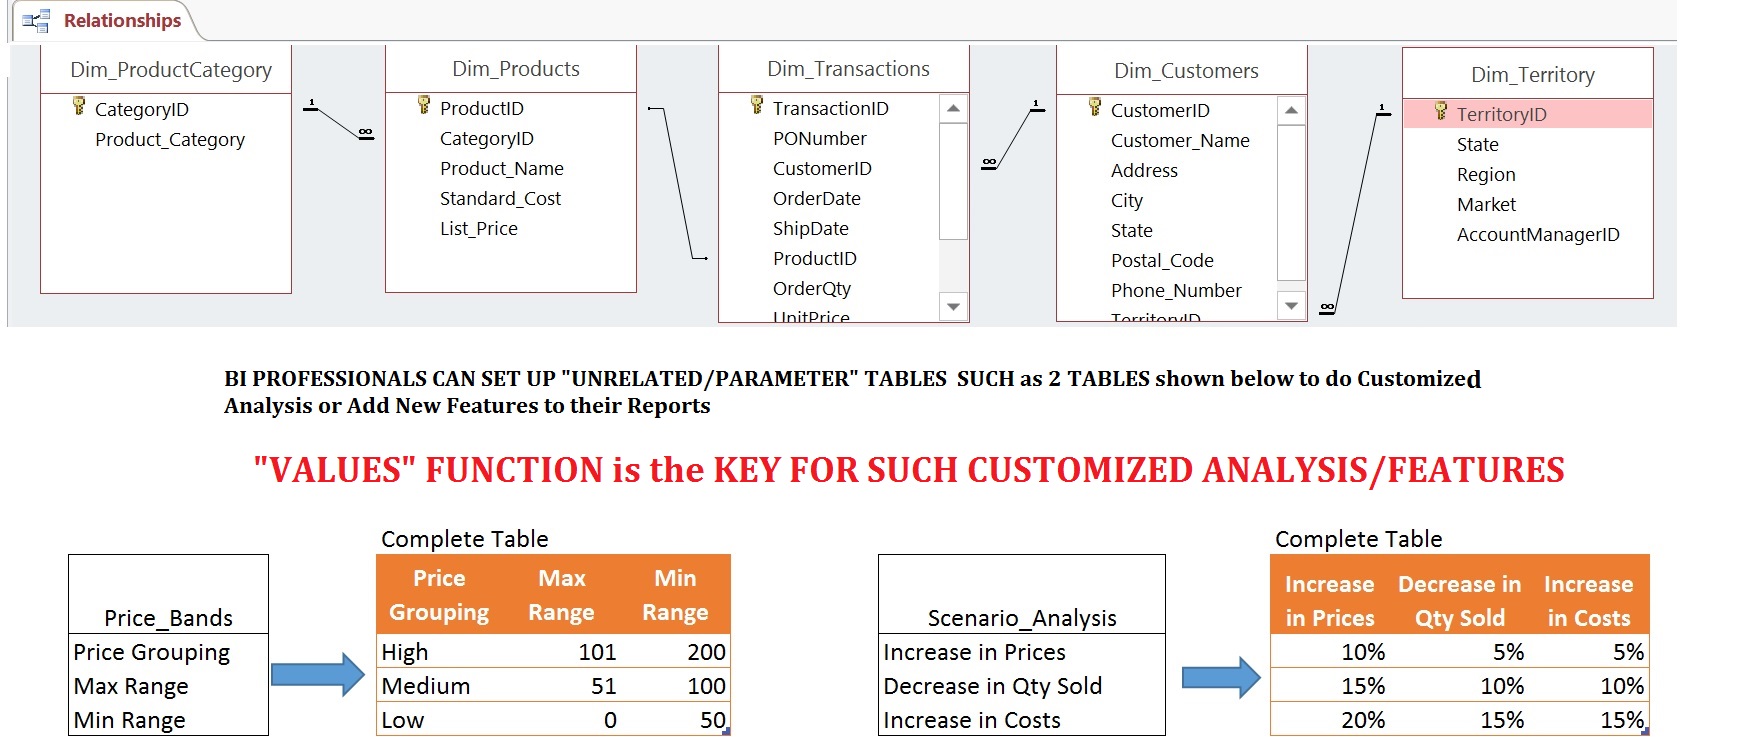
Unrelated Tables/ Parameter Tables are tables that are unrelated to the rest of data model. Infact they cannot be related to any other table in the data model because there is no common column or Key
For example, a modeler can set up tables to
- Do scenario analysis such What if prices increased by certain %ages?
- Group Prices into Price Bands such as “High”,”Medium”, “Low”
- Add a “Sort By” or “Sort Type” option for users of report
- Add an option for users to scale values (show in million, thousands or full figures)
- Do Several other things one could imagine
Here is the KEY POINT
“THIS USE OF UNRELATED OR PARAMETER TABLES TO ENHANCE YOUR DATA MODEL IS MADE POSSIBLE BY “VALUES“ Function in DAX”
SOME BACKGROUND:
VALUES function is an extremely Powerful function in DAX. We
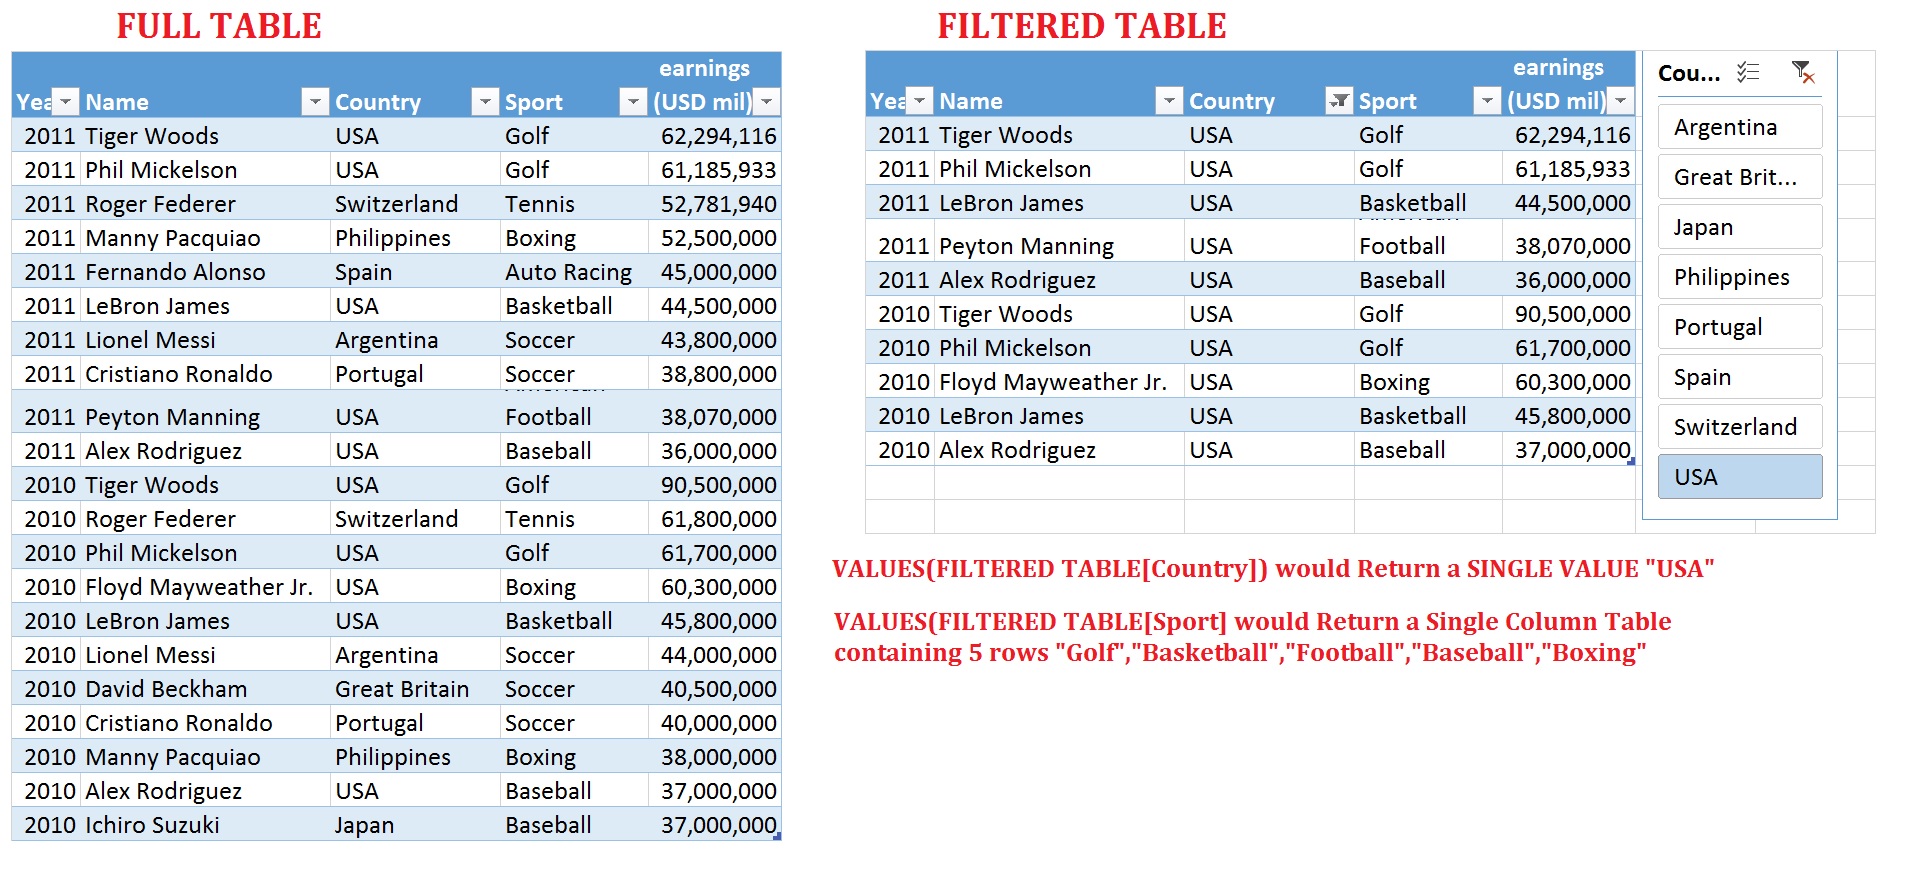
know that “VALUES” function returns a one-column table that contains the distinct values from the specified table or column’
But more importantly VALUES function maintains “THE EXISTING/ CURRENT FILTER CONTEXT”. That is to say that the distinct values returned are those that are visible in the current filter context
This means that a single item selected in a “Slicer” could return a “Single Value” representing the item selected in the Slicer.
This feature opens a whole world of creative opportunities for Business Intelligence through the use of “UnRelated Tables” i.e. Tables that are unrelated to rest of the Data Model
You can set up UnRelated Tables to do lot of creative and customized analysis such as scenario “What If” analysis, Grouping Prices and many more things you could imagine
ILLUSTRATIVE EXAMPLES
Some Illustrative examples will make it clear. I will first give 2 examples how i have used it and then 2 examples taken from websites of 2 greats of BI world, Rob Collie and Marco Russo.
1) Select Different Filters for CALCULATE function in DAX
In this simplified example I am analyzing the top 10 highest paid athletes in the world for the past 5 years from 2009 to 2013.
Click to download this example
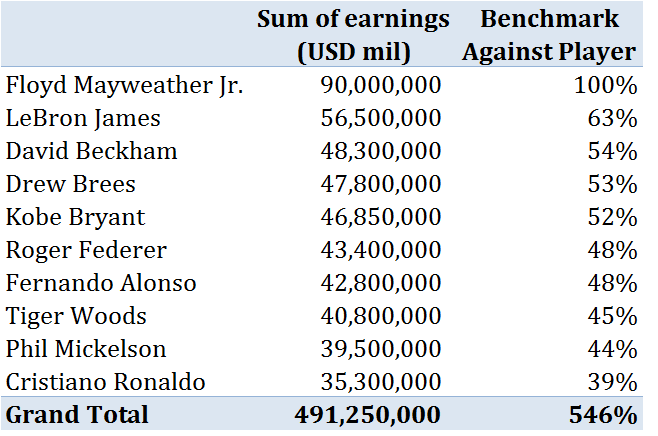
Now I want to compare their earnings against any single player let’s say Roger Federer. Very Simple. The DAX Measure that would let me do this is
Benchmark Against Player =Sum of earnings (USD mil) /CALCULATE([Sum of earnings (USD mil)],Table1[Name]=”Roger Federer”)
Now if I want to change the Benchmark Player lets say to Floyd Mayweather Jr., I would have to go back to the DAX formula and replace Roger Federer with Mayweather Jr.
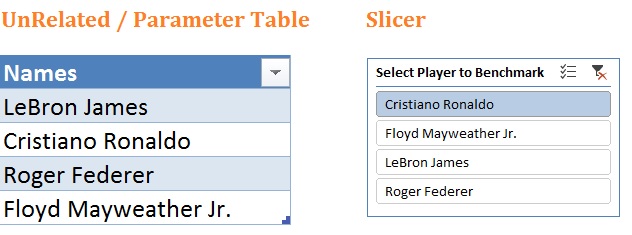
To do away with manual process above, I create a list of some players as benchmarks, convert this list to a single Column Table and Add it to Data Model.
Once it is in the Data Model, a slicer can be created on it.
Once you insert this slicer it will do nothing until you link it to the DAX Measure. Recall the Calculated Field/Measure we calculated above
Benchmark Against Player =Sum of earnings (USD mil) /CALCULATE([Sum of earnings (USD mil)],Table1[Name]=“Roger Federer”)
Now since we know that a single item selected in the Slicer will cause VALUE(Column on which slicer is based) to return a single value that is the “Item Selected”
This implies that we can replace “Roger Federer” above with VALUES(Column on which slicer is based)
So our Final Formula looks like this
Benchmark Against Player =Sum of earnings (USD mil) /CALCULATE([Sum of earnings (USD mil)],Table1[Name]=VALUES(Names[Names]))
2) Completely change the behavior of CALCULATE
One of the many interesting usages of “CALCULATE” function is to express values as a %age of something. This could be
As a %age of total or
As a %age of category
As a %age of sub category
VALUES function along with UNRELATED TABLE can be used to interactively switch between these different BASES
Click to download this example
In this example, I am using the same data i.e. the data of top 10 highest paid athletes in the world for the past 5 years from 2009 to 2013 but this time I am comparing the Individual Athlete’s earnings against earnings of
- All Players of Same Country
- All Players of Same Sport
- All Players of Same Country Same Sport
Instead of creating 3 separate Measures/Calculated Fields for above comparisons I can create a single Measure/Calculated Field and choose the desired comparison using Slicer.
3) User-friendly-report-sorting-with-slicers/
Click above link to see the post.
In this post, the Power Pivot Maestro, Rob Collie sets up two dummy and unrelated tables (unrelated to the data model) to sort the pivot tables which were built using the main data model.
See how intelligently VALUES function is used here
4) Scale of Values
Click above link to see the post.
In this post, the Power Pivot Maestro,Marco Russo sets up a two column unrelated table (unrelated to the data model) to change the scale of values. i.e. show values in thousands, millions or full figures.