Microsoft Excel automatically truncates the VALUE Axis or X-Axis of charts when the variance between the lowest and highest values of the DATA is less than 20%.
While this truncation is desirable for LINE charts where the purpose is to depict trends, this could be misleading for charts such as COLUMN charts or BAR charts where the main purpose is to show comparison among discrete categories
To make it clear, lets copy the data below to Excel and insert a column or a bar chart
| Company | Revenue |
| Microsoft | 94 |
| Amazon | 98 |
| Apple | 110 |
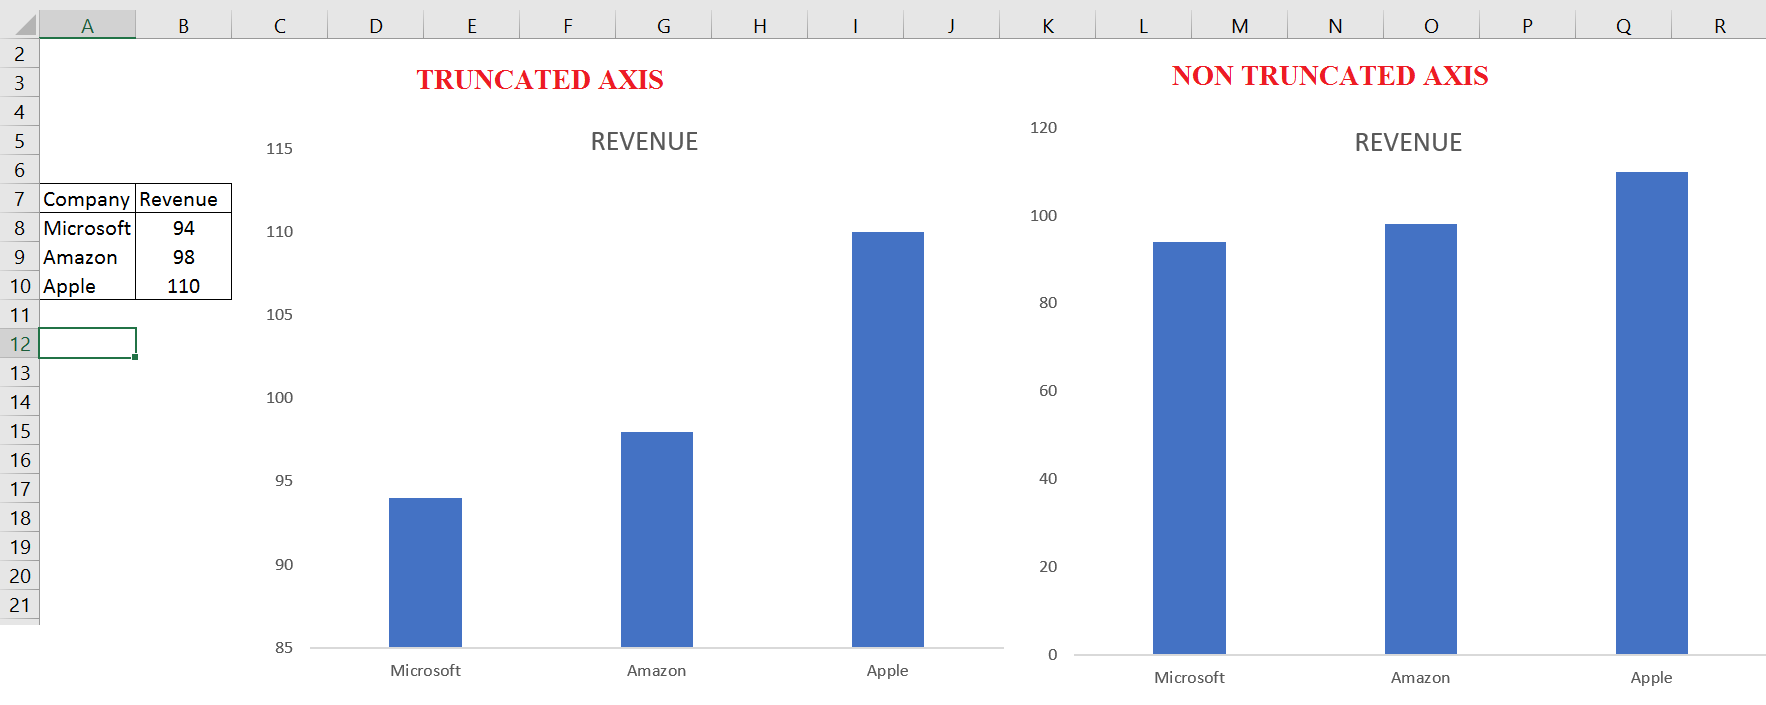
The Bar Chart on the left above gives the MISLEADING IMPRESSION that Microsoft’s Revenue is less than half of Apple’s Revenue. The Column chart on the right depicts the situation fairly.
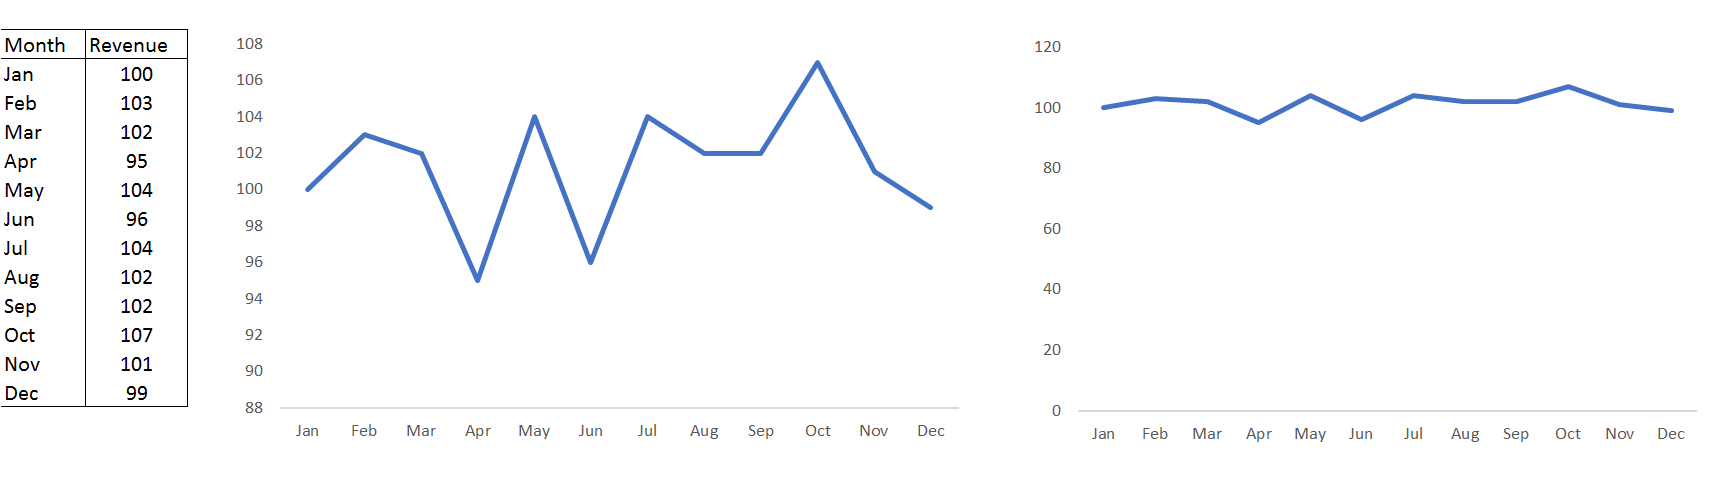
However, for LINE charts where the main purpose is to depict trends, VALUE AXIS can be TRUNCATED or we can say it is desirable to TRUNCATE to depict the trend clearly. The figure below shows this
Please support my suggestion by voting for it on the link below